From Zero to OTel: Architecting a Stateless Tracing SDK for GenAI
Introduction
Unlike deterministic systems, GenAI introduces fundamental unpredictability to production environments. Traditional observability tools fail to capture the semantic drift, hallucination patterns, and prompt-dependent behaviors inherent to large language models. While conventional systems map cleanly from input to output, GenAI requires monitoring the unexplored territory between what we asked for and what we got.
Effective GenAI observability instruments this gap, providing visibility into model performance degradation, embedding drift, and reliability issues before they cascade into production incidents—transforming observability from a debugging luxury to an operational necessity.
At Maxim, we are committed to building an end-to-end platform for GenAI companies and helping them streamline their:
- Experimentation with advanced prompt playground, visual chains, and real-time comparisons to accelerate development
- Pre-release testing of APIs with comprehensive evaluation across faithfulness, context relevance, hallucination detection, and PII screening
- Post-release observability that combines quantitative metrics with qualitative insights to continuously optimize performance
In this post, we explore our architecture for a fully stateless distributed tracing system that is 100% compatible with OpenTelemetry. The system provides complete visibility by:
- Capturing every interaction from request initiation to final response, including all LLM calls, function chains, and traditional system component traces (like databases, caches, and microservices)
- Maintaining zero state or storage requirements through innovative use of context propagation and trace correlation
- Full OpenTelemetry compatibility for seamless integration with existing observability stacks and visualization tools
Architectural principles
While building our logging system, we prioritized compatibility with existing observability infrastructure rather than creating a disconnected solution. This was crucial since GenAI workflows often integrate with traditional system components.
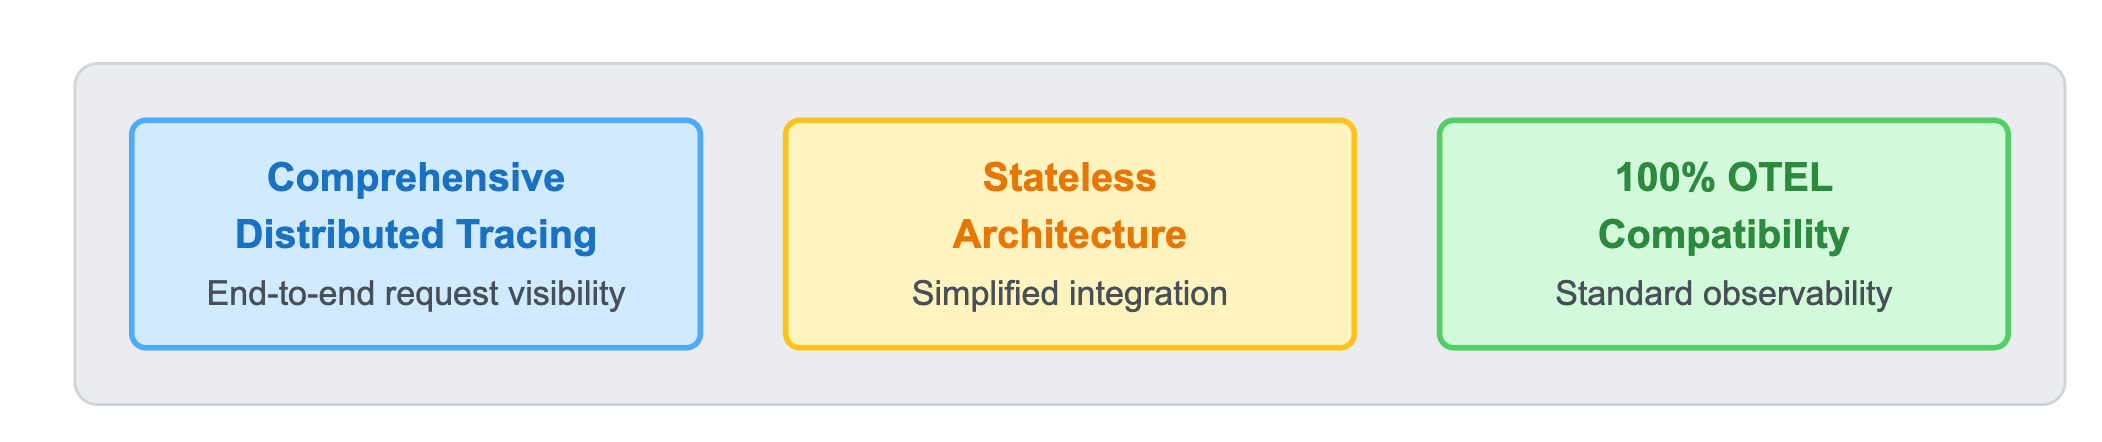
The platform is built upon three fundamental architectural principles:
1. Comprehensive Distributed Tracing
Maxim's architecture allows you to capture the complete request lifecycle, including pre-and post-LLM call data. This end-to-end visibility gives developers exhaustive insights into their application flow, enabling precise monitoring and debugging capabilities.
2. Stateless architecture
Maxim's SDK uses a stateless architecture that eliminates complex state management across functions, classes, and microservices. This reduces integration complexity while maintaining comprehensive observability.
3. 100% OTel compatibility
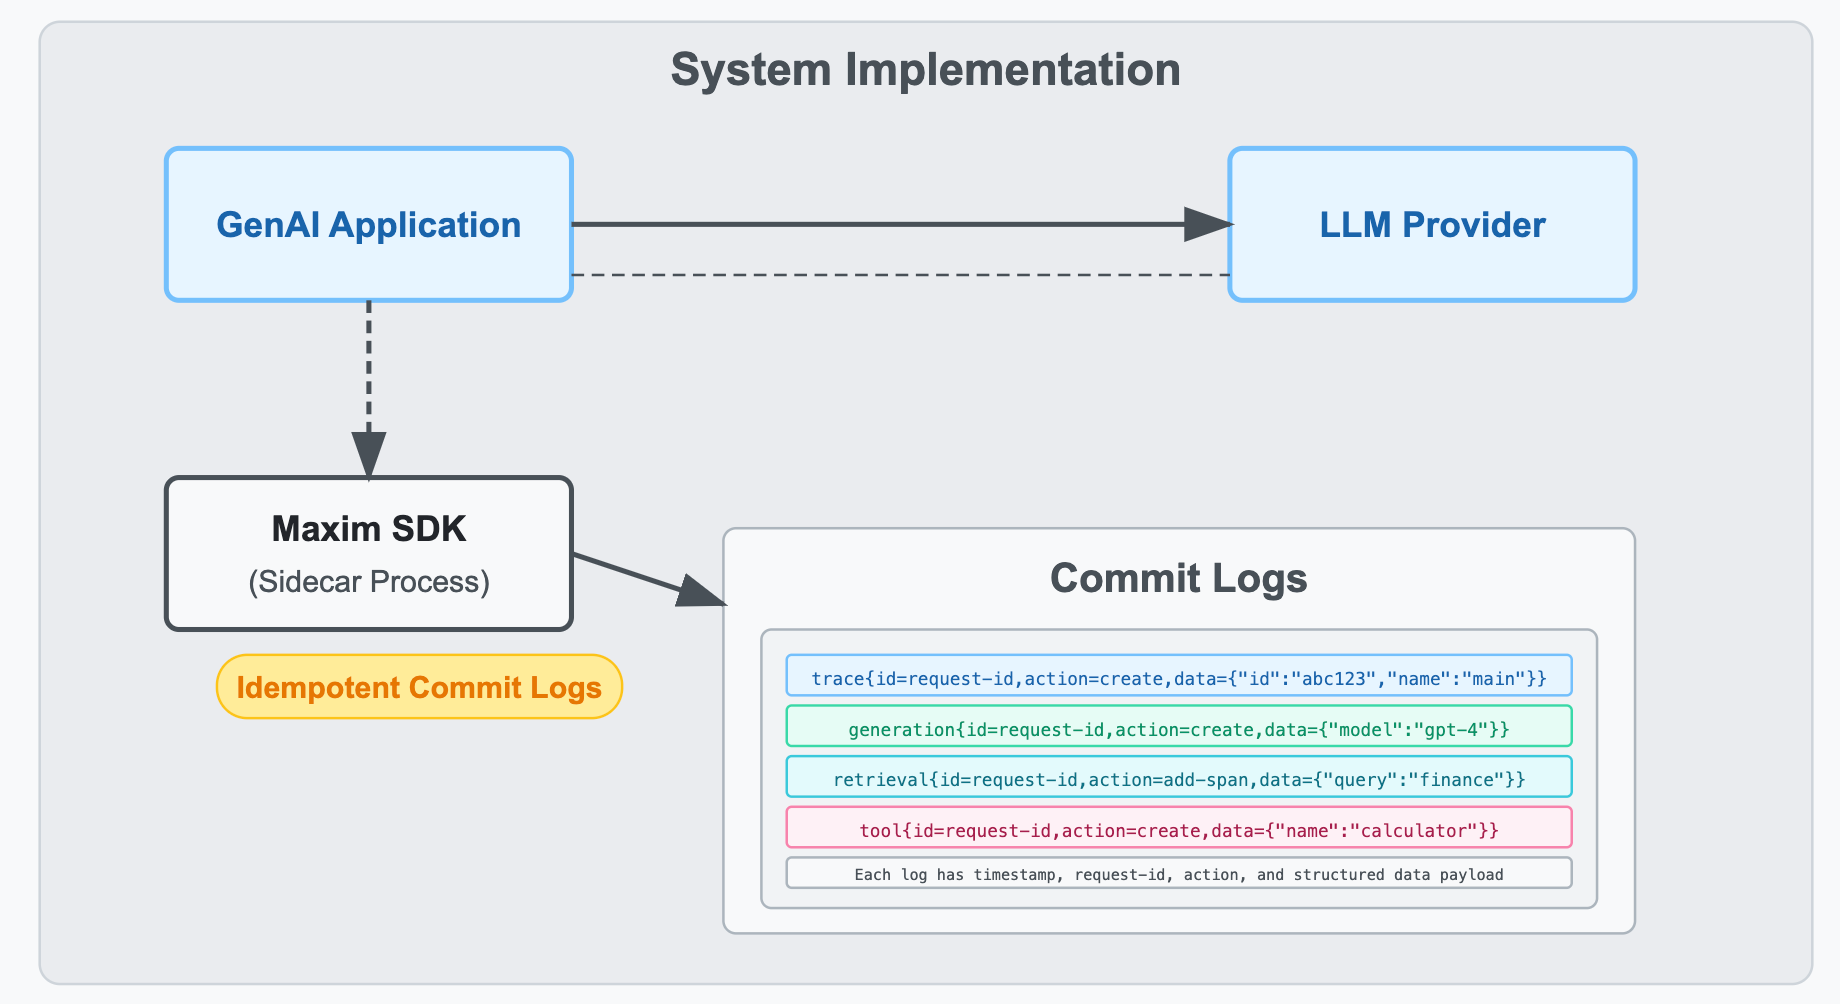
Maxim logging is inspired by (and 100% compatible with) open telemetry. Every function call you make via the Maxim logging SDK generates an idempotent commit log for our server. Maxim's logging system is designed for high concurrency and extremely flaky network systems. Irrespective of which order these commit logs reach Maxim servers, the final timeline of your trace will always be intact. This has been tested on over a billion logs indexed last year.
Maxim's observability supports standard components like sessions, traces, spans, and events. We extend this with specialized components for AI/ML workflows:
- Generation - Tracks a single LLM call
- Retrieval - Tracks a single retrieval
- Tool call - Tracks a tool call
Coming up with the protocol
From day 0, we wanted to make integration effortless for developers, having seen the complexity challenges with frameworks like Langsmith and equivalents.
We built mxin-2 (pronounced as mixin v2), a protocol modeled after StatsD's commit log pattern where each operation acts as an independent commit. The protocol supports 5 core entities with 25 mutation types, enabling atomic, self-contained operations that simplify state management and integration. With this pattern, we eliminated client-side state management since entities can be mutated using just their ID, making our SDK significantly simpler to integrate and use.
Example
Let's take this enterprise chatbot system similar to Glean. And let's say you want to start capturing trace and individual spans using Maxim SDK.
import { Maxim } from "@maximai/maxim-js";

const maxim = new Maxim({ apiKey: "api-key" });
const logger = await maxim.logger({ id: "log-repository-id" });

// Once you initialize at a central place, creating a trace is a single command

const trace = logger.trace({
    id: req.headers["cf-request-id"],
    name: "user-query",
    tags: {
        userId: req.body.userId,
        accountId: req.body.accountId
    },
});
This command generates and sends the commit log to the Maxim logging servers.
trace{id="<cf-request-id-value>",action=create,data={"name":"user-query","tags":{"userId": "<req.body.userId value>","accountId": "<req.body.accountId value>"}}}To add a new span to this trace
// get hold of trace with id
const trace = logger.trace({id:"request-id"})
const span = trace.span({
    id: uuid(),
    name: "plan-query",
    tags: {
        userId: req.body.userId,
        accountId: req.body.accountId
    },
});
trace{id="<cf-request-id-value>",action=add-span,data={"id":"<uuid>","name":"plan-query",tags:{"userId": "<req.body.userId value>","accountId": "<req.body.accountId value>"}}}Now any operations on that span will modify the span entity using similar commands.
Advantages of a stateless SDK
Traditional observability SDKs typically maintain state, requiring developers to pass span or trace objects between functions, track their lifecycle, and ensure proper context propagation across service boundaries. This creates tight coupling, increases implementation complexity, and introduces potential memory leaks or broken traces when objects aren't properly maintained.
In contrast, Maxim's stateless architecture eliminates these burdens. By using only entity IDs for reference, developers can manipulate traces and spans from anywhere in the system without maintaining object references. This approach provides remarkable flexibility - a function in one microservice can start a span, another function in a completely different service can add events to it, and a third can close it, all without sharing any state beyond the span's ID. This dramatically simplifies instrumentation across distributed systems while maintaining complete trace coherence.
For example, in the enterprise chatbot system described earlier, one service might handle the initial query processing:
// In query processing service
const trace = logger.trace({
    id:requestId,
    name:"user-query",
    tags:{ userId, accountId }
}));

// Start a span for the planning phase
trace.span({
    id:"plan-span-id",
    name:"planning-phase"
});

// Pass just the requestId and span ID to the next service
triggerDocumentRetrieval(requestId, "plan-span-id", query);
Then in a completely separate document retrieval service:
// In document retrieval service
function retrieveDocuments(requestId, spanId, query) {
    // Reference the existing span by ID only
    const trace = logger.trace({id: requestId});
    const span = logger.span({id: spanId});

    // Add events to the span
    span.event(uuid(), "retrieval-started", { queryText: query })
    //         ^ id     ^ name               ^ tags

    // Perform retrieval operations...

    // End the span when complete
    span.end();
}
This flexibility enables seamless observability across complex distributed systems without the overhead of state management.
Handling High-Scale Production Challenges
While this approach makes integrating our SDK nearly seamless, it significantly increases server-side complexity by several orders of magnitude.
Message Ordering:
Network latency, concurrent processing, and system delays can cause these commit logs to arrive in any order. trace.end can come way before trace.create. This creates complex orchestration challenges, as we must reconstruct the correct sequence regardless of arrival order.
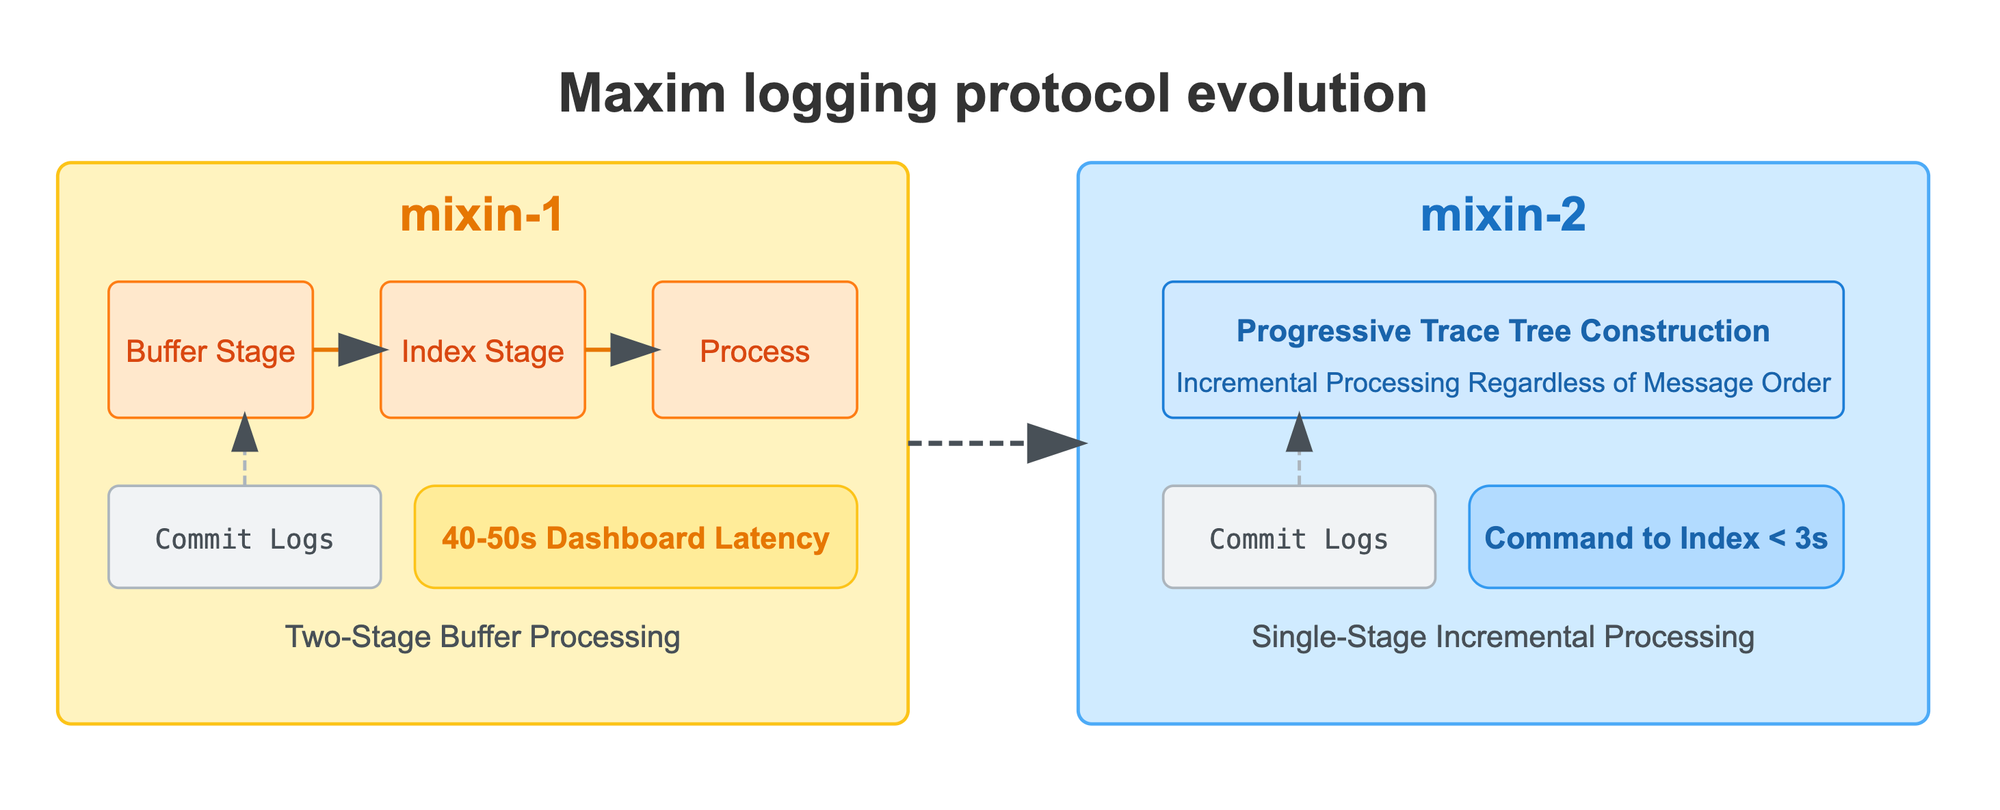
Our approach to this challenge evolved significantly over time. In protocol v1, we implemented a two-stage process: first buffering all incoming commands until receiving the end-of-trace signal, followed by an indexing stage with an intentional out-of-order delay before final processing. While effective, this approach introduced substantial latency—traces would take 40-50 seconds to appear on Maxim dashboards, creating a frustrating experience for users needing real-time insights.
In protocol v2, we completely reimagined this process by eliminating the two-stage ingestion. Now, we progressively construct the trace tree as logs arrive in the system, regardless of their sequence. This approach leverages a document database that supports incremental construction of extremely large trace structures without requiring complete data presence. The result has been transformative—reducing indexing time from 40-50 seconds to under 7 seconds (95th percentile), while still ensuring we never drop a message and maintaining complete trace reconstruction fidelity.
Entity Updates
Unlike OTel, which drops events after an end sequence, we allow users to modify any entity indefinitely—such as adding feedback to a trace. As we progressively prepare the trace tree, in 99.99% of cases we know which subtree is going to be mutated because of the incoming command.
Hence, allowing indefinite mutation is easy for us. This architecture also helps us store larger payloads at each node of the tree (in the order of 1MB). Our customers have successfully stored traces of size north of 100 MB per trace. This approach ensures that historical traces can be enhanced with new information (like user feedback, analysis results, or retrospective tagging) while maintaining query performance and data integrity, even with substantial data volumes.
Real-time Processing
Building on our message ordering system, we implemented a high-throughput processing pipeline to handle real-time data at scale. We use Kafka messaging queues alongside > 4k concurrent Go workers to manage high-volume, out-of-order writes. Our load tests demonstrate the system's capability to index 10,000 independent out-of-order trace commands within a minute, ensuring rapid processing even during peak loads. At peak, the system processes over 100k messages a second.
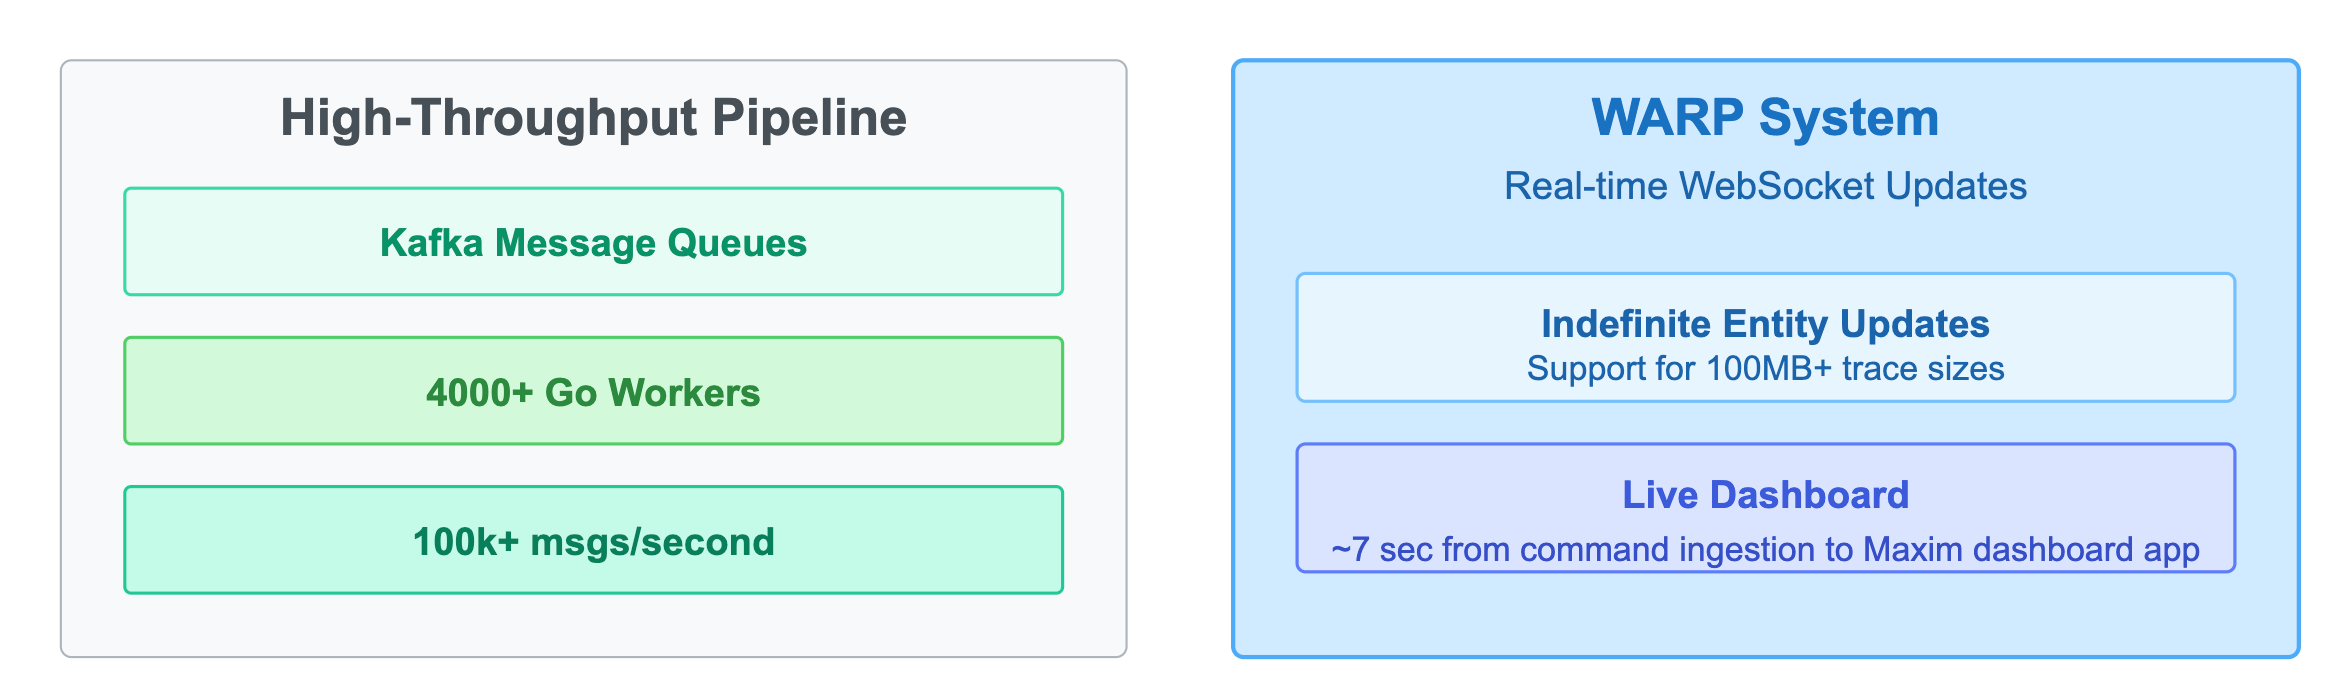
To enhance the user experience, the Maxim dashboard maintains a live WebSocket connection with our server through a system we call WARP. This connection updates dashboards in real-time as logs are received, ensuring you always see the latest data. The real-time updates work seamlessly even when you're using filters or other dashboard customizations, giving you immediate visibility into your application's behavior.
These engineering solutions support our fundamental goal: keeping SDK integration simple with near-zero state management requirements. Our infrastructure handles all the complexity behind the scenes, allowing development teams to focus on their applications rather than wrestling with observability implementation details.
OTel compatibility
Maxim provides 100% compatibility with OpenTelemetry, allowing you to seamlessly integrate our observability platform into your existing infrastructure. This compatibility works in two key directions:
Ingest OTel traffic directly
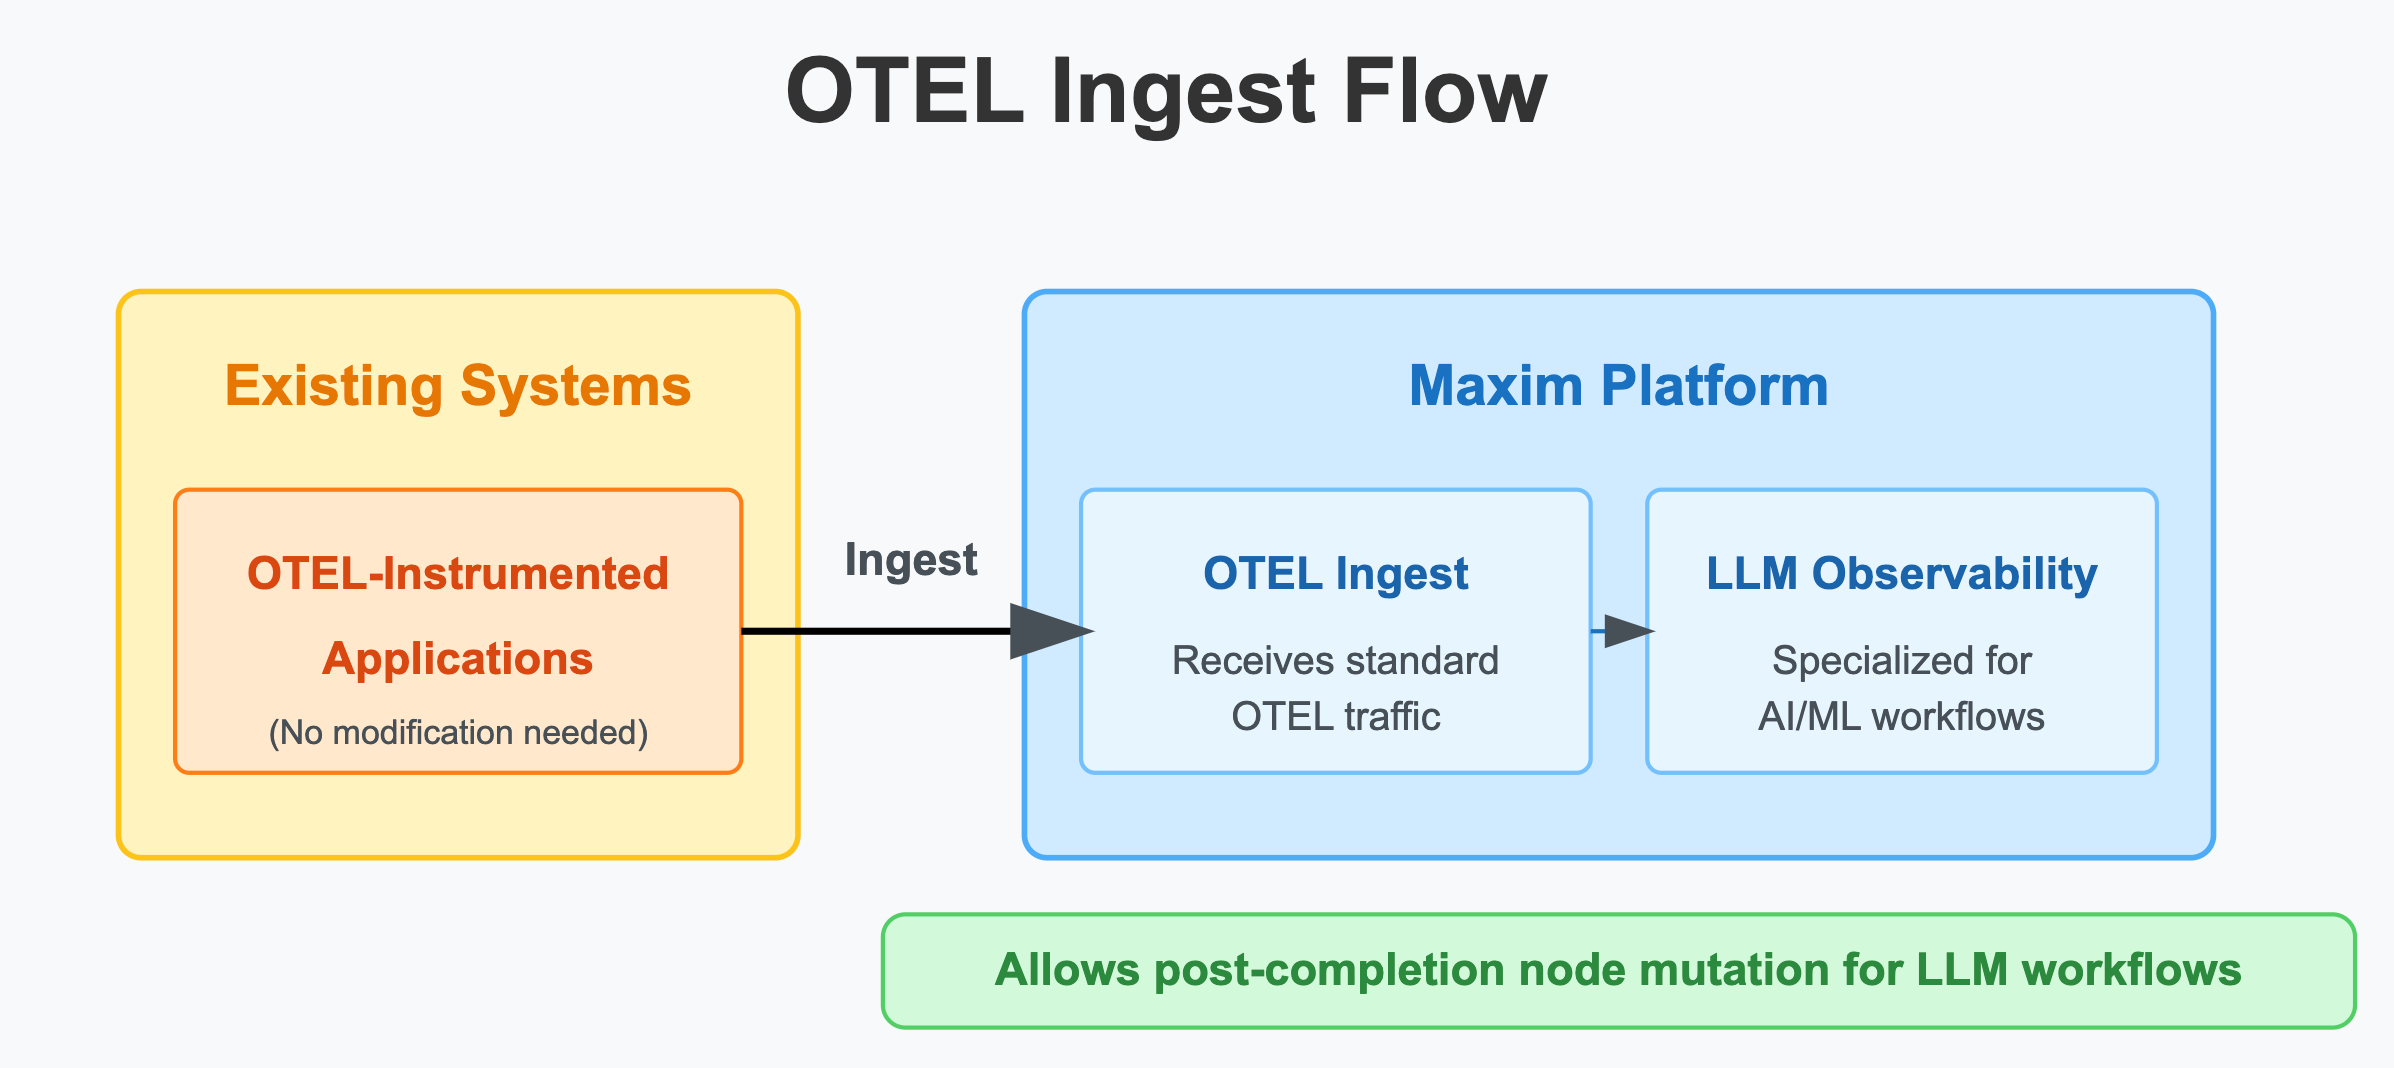
We can receive and process standard OTel traffic with zero modifications to your existing instrumentation. This means you can immediately leverage Maxim's real-time evaluations and alerting system without changing your current setup. A significant advantage over standard OTel implementations is that Maxim allows you to mutate nodes even after receiving an end command. This is particularly valuable for LLM-based workflows which tend to be long-running, where you might need to attach additional information (like user feedback or evaluation results) to completed traces.
Write-through to other OTel platforms
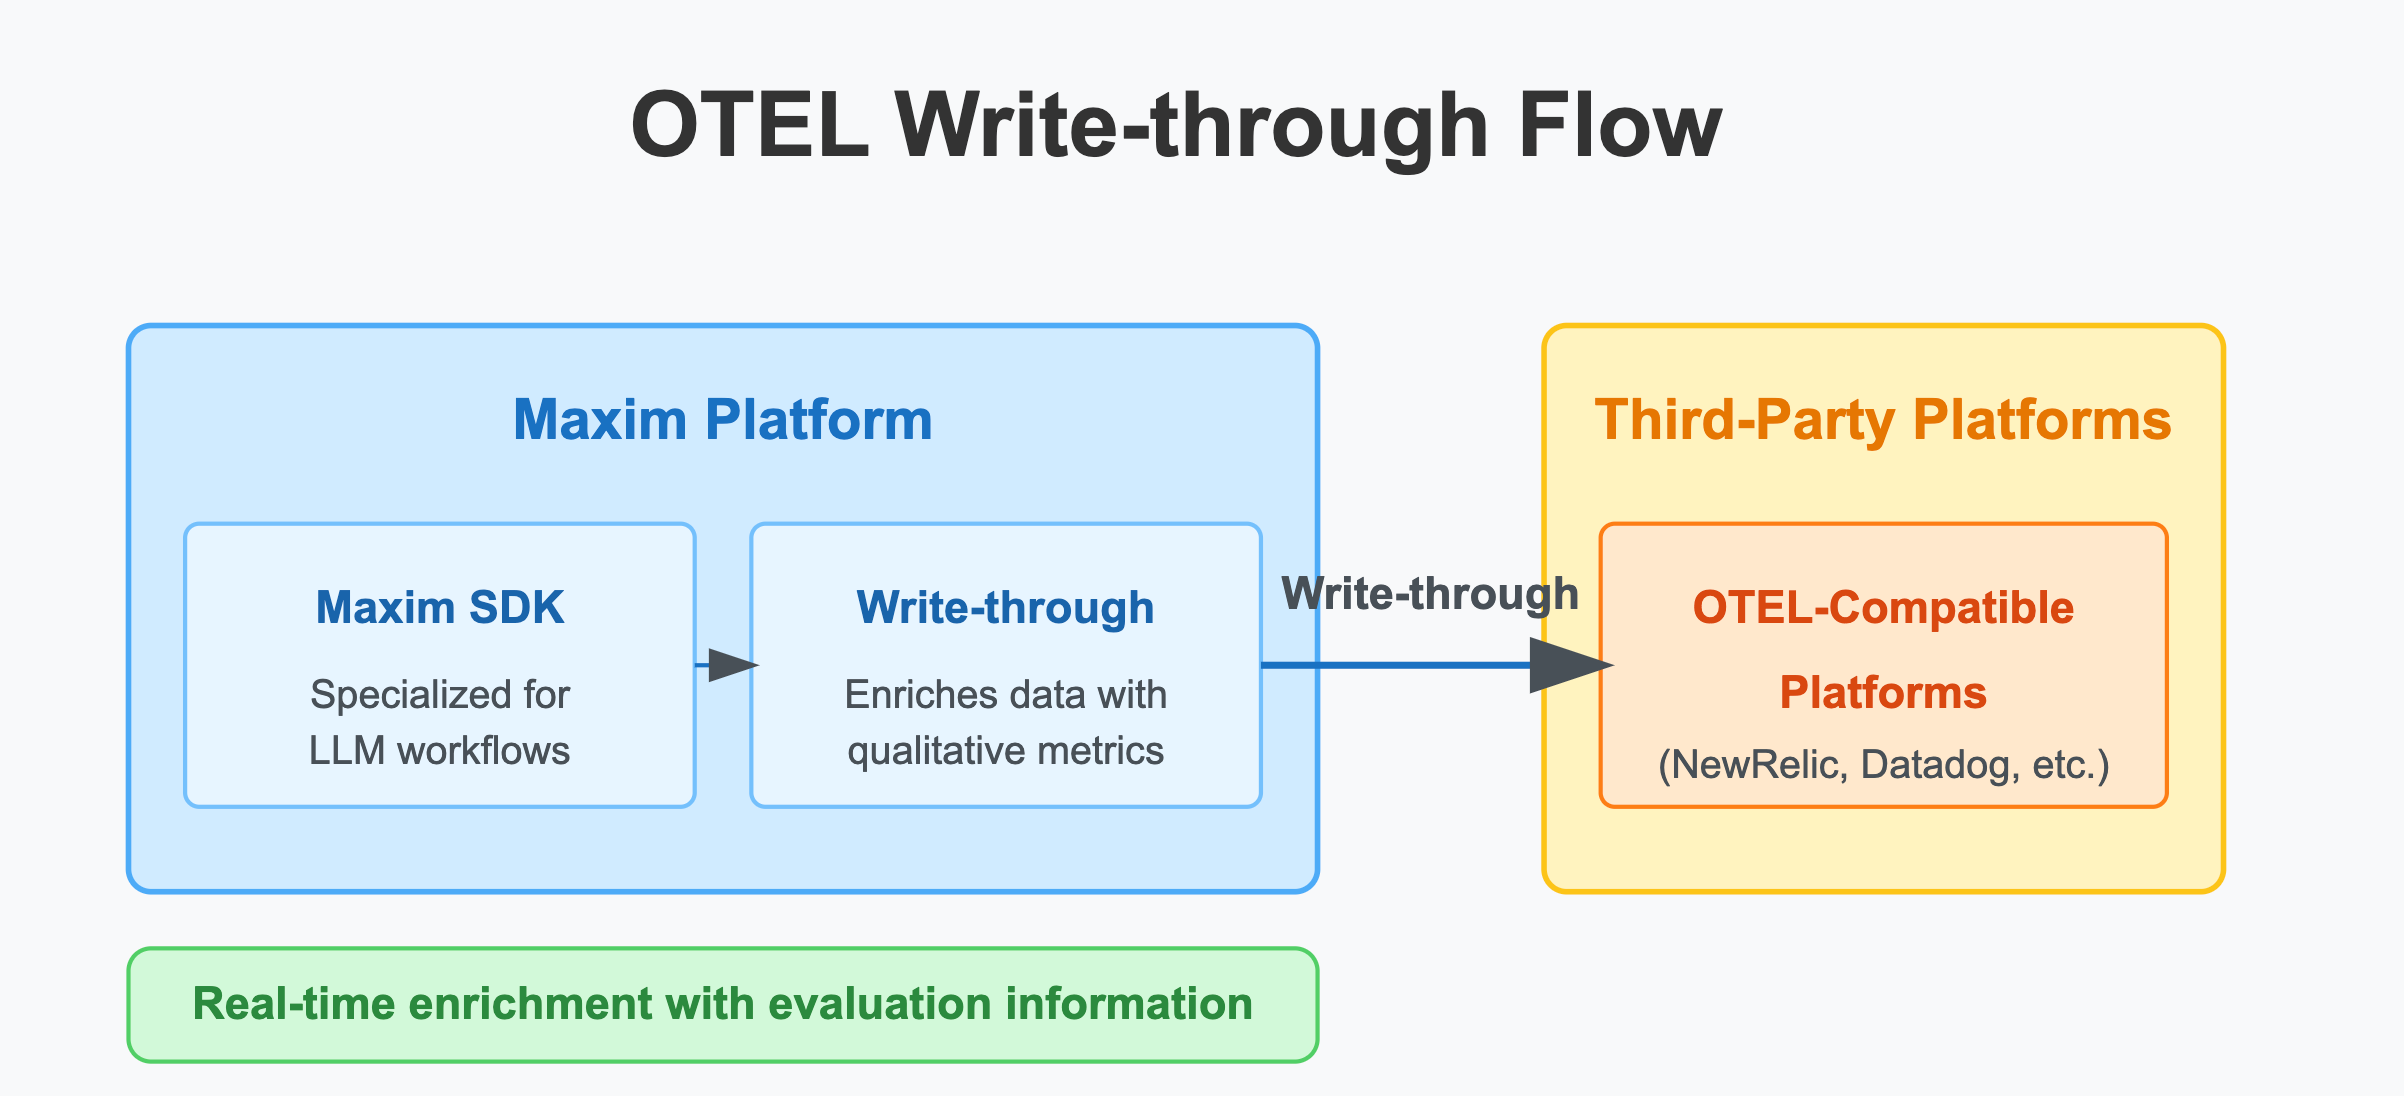
When you use the Maxim SDK to send logs to our platform, we also support write-through functionality to any OTel-compatible logging platforms such as NewRelic, Datadog, and others. This gives you the best of both worlds - you can continue using your existing observability tools while also gaining access to Maxim's specialized LLM observability features. The key advantage here is that Maxim enriches the data with real-time evaluation information, providing clear qualitative metrics for your production data that standard OTel implementations don't capture.
The two-way compatibility with OpenTelemetry means you can start using Maxim at your own pace. You can keep your current monitoring tools while adding Maxim's features, and get better insights into your AI applications without having to change your existing processes or end up with disconnected monitoring systems.
Coming in Part 2
In the next part of this series, we'll dive deeper into several advanced capabilities of the Maxim platform:
- How we enable online evaluation on live systems at each node of your traces, providing real-time quality insights
- Agentic simulation, logging, and online evaluation of entire interaction graphs
- Realtime alerting built on top of our online evaluation system
- Live reporting, aggregates for CXOs, governance frameworks, and data security measures
Stay tuned as we explore how these features combine to create a comprehensive observability solution specifically designed for modern AI systems.