Evaluating data contamination in LLMs

Introduction
In recent years, large language models (LLMs) like GPT and Llama have constantly been pushing accuracy numbers on popular benchmarks. However, one issue that has become increasingly important is data contamination—the overlap between a model’s training data and the evaluation benchmarks used to assess its performance. This contamination can inflate benchmark scores, leading to overly optimistic evaluations of model capabilities. While it’s widely acknowledged that evaluation data contamination affects benchmark scores, how much contamination matters and how to accurately detect it remain open questions.
In a recent study, a new method called ConTAM was proposed to help address these questions. The study evaluates the effects of contamination on benchmark scores using four different contamination metrics and a large set of models and benchmarks. Here’s a deeper look at the findings and why they matter.
What is data contamination?
Data contamination occurs when a model is ‘trained on the test set’. This overlap can happen in two ways:
- Exact matches: An example from the benchmark appears verbatim in the training data.
- Partial matches: A portion of the benchmark example is found in the training data, potentially leading the model to ‘remember’ it.
But how do we measure contamination? Does a verbatim match count, or should partial appearances in the training data be considered contamination as well? If an example occurs verbatim once in a 1.4T token training corpus, does this give the model an unfair advantage? Defining partial contamination is tricky, and setting the right thresholds for what constitutes ‘contaminated’ data is essential. Moreover, how much contamination really impacts model performance is still up for debate.
Methods used for studying contamination till now
Causal contamination analysis: It involves specifically training models on contaminated data and measuring the increase in benchmark performance. This analysis is expensive to perform as it requires finetuning large models on various dataset with various perturbations.
Post-hoc contamination: This approach focuses on identifying samples from evaluation benchmarks that were contaminated in the pre-training data, thus removing them to reach a ‘clean’ subset to measure the difference in performance between the two. The benefit is there is no training involved and correlation notions can be applied.
Memorization in LLMs: It is similar to contamination and involves regurgitation of data seen in pre-training. These methods tend to focus on approximating contamination without access to pre-training data, for instance, via membership inference attacks. However, current methods in this space that do not actually search the pre-training data have been shown to be ineffective for accurate contamination detection.
ConTAM: A new approach to assess contamination
To better understand these issues, the study introduces ConTAM (Contamination Threshold Analysis Method). ConTAM provides a systematic approach to analyzing contamination by measuring how contamination metrics change with different thresholds and evaluating their impact on model performance. It focuses on identifying contaminated examples in the evaluation benchmark and measuring how much they affect the model's performance.
Four contamination metrics
The study tested four primary contamination metrics, each defining contamination in terms of overlapping n-gram spans (sequences of words or tokens):
- TOKEN-MATCH: This metric identifies contaminated tokens in the evaluation sample that match tokens in the pre-training corpus. It counts how many tokens in the evaluation data overlap with tokens seen during training.
- NGRAM-MATCH: Instead of looking at individual tokens, this metric focuses on n-grams—continuous sequences of n tokens. It calculates the fraction of the n-grams in the evaluation sample that match those in the training data.
- TOKEN-EXTEND: This metric extends the contamination detection to account for mismatches between tokens. It allows for small deviations (a "skip budget") between the evaluation and training data, allowing for more flexible matching.
- LONGEST-MATCH: Building on TOKEN-EXTEND, this metric only considers the longest contiguous contaminated span in the evaluation sample. It avoids assigning high contamination scores to cases where many small spans match different parts of the training data, which could lead to inflated contamination scores.

The impact of contamination on benchmark scores
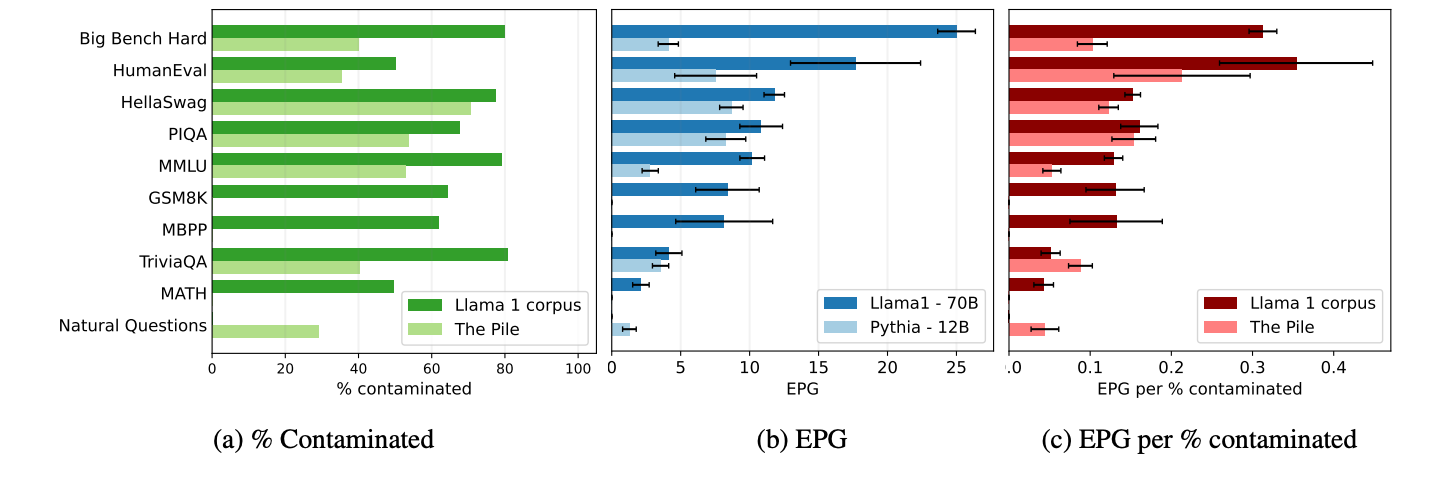
To quantify the effect of contamination on model performance, the study uses the Estimated Performance Gain (EPG). The EPG for a contamination metric is defined as the difference of the model’s performance on the entire benchmark and the clean uncontaminated benchmark. A higher EPG indicates that contamination has a substantial impact on the model’s reported performance.
The study found that larger models benefit more from contamination than smaller ones. For example, Llama 1, a large model, showed significant performance increases (over 20%) on several benchmarks due to contamination. On the other hand, Pythia, a smaller model, exhibited much lower performance gains from contamination, with increases ranging from 2% to 8%.
Key Findings
- Contamination has a larger impact than previously reported: The study reveals that contamination can have a much more significant effect on benchmark scores than previously thought, particularly for large models. This is likely due to false negatives in existing contamination detection methods that fail to flag contaminated examples accurately.
- Metric choice matters: Among the four metrics tested, LONGEST-MATCH proved to be the most effective at detecting contamination and its impact across multiple benchmarks. It consistently found higher EPGs compared to other metrics, particularly for large models.
- Smaller n-grams are better: The study also found that using smaller n-gram sizes (i.e., n < 8) when defining contamination leads to more accurate detection. Larger n-grams or higher thresholds for contamination detection often missed key contamination examples, leading to false negatives.

- Contamination impact varies by model size: Larger models, like Llama 1, are better able to leverage contaminated examples, resulting in higher performance gains when contamination is detected. Smaller models, like Pythia, do not show the same level of improvement.
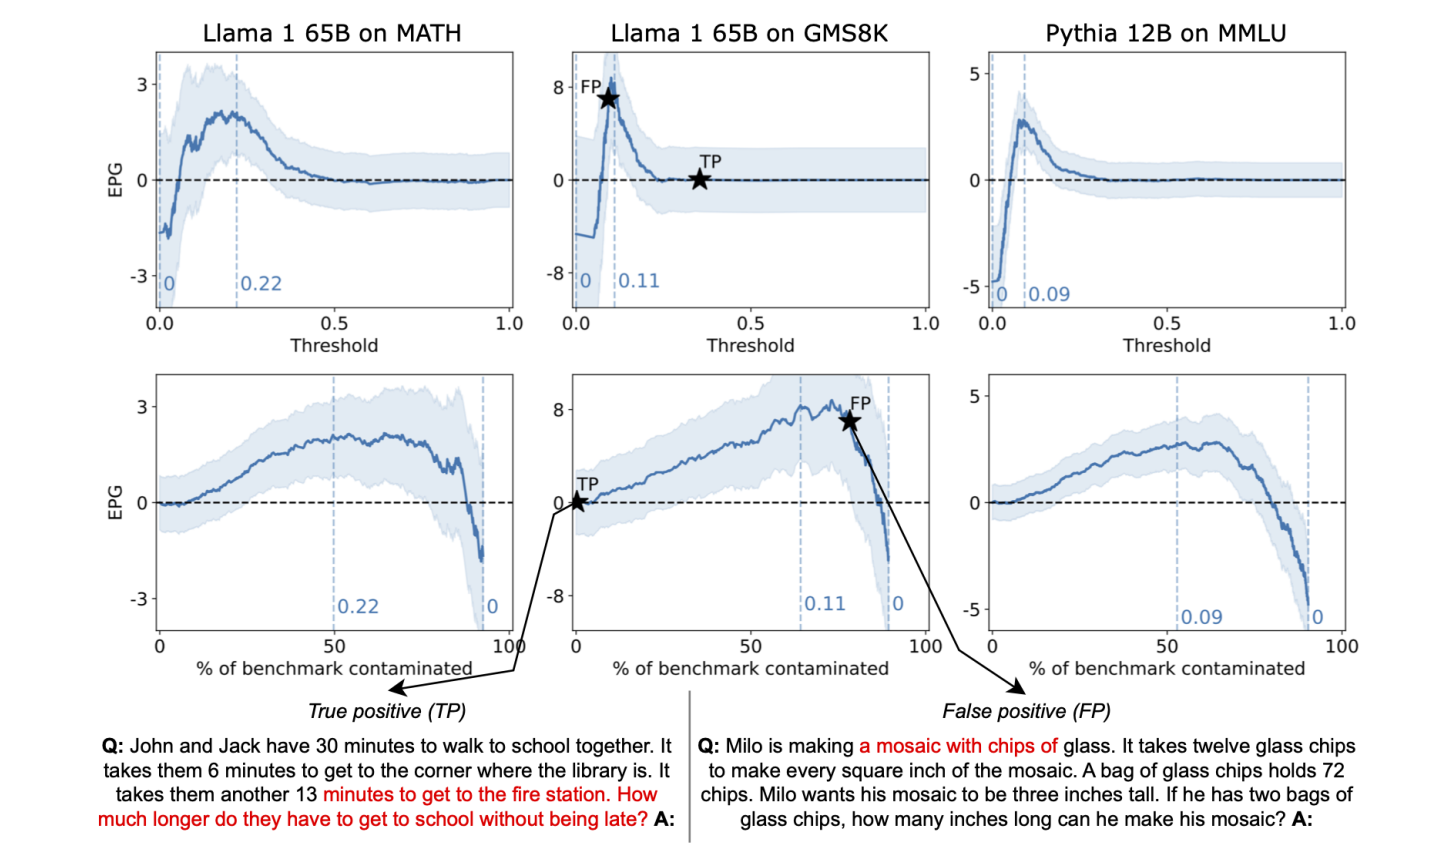
- Threshold selection is model-dependent: The study emphasizes the importance of model-specific threshold selection. A single contamination threshold doesn’t work well across different models, so choosing the right threshold is crucial for accurately measuring contamination’s impact.
Evaluating the metrics: Contamination threshold analysis
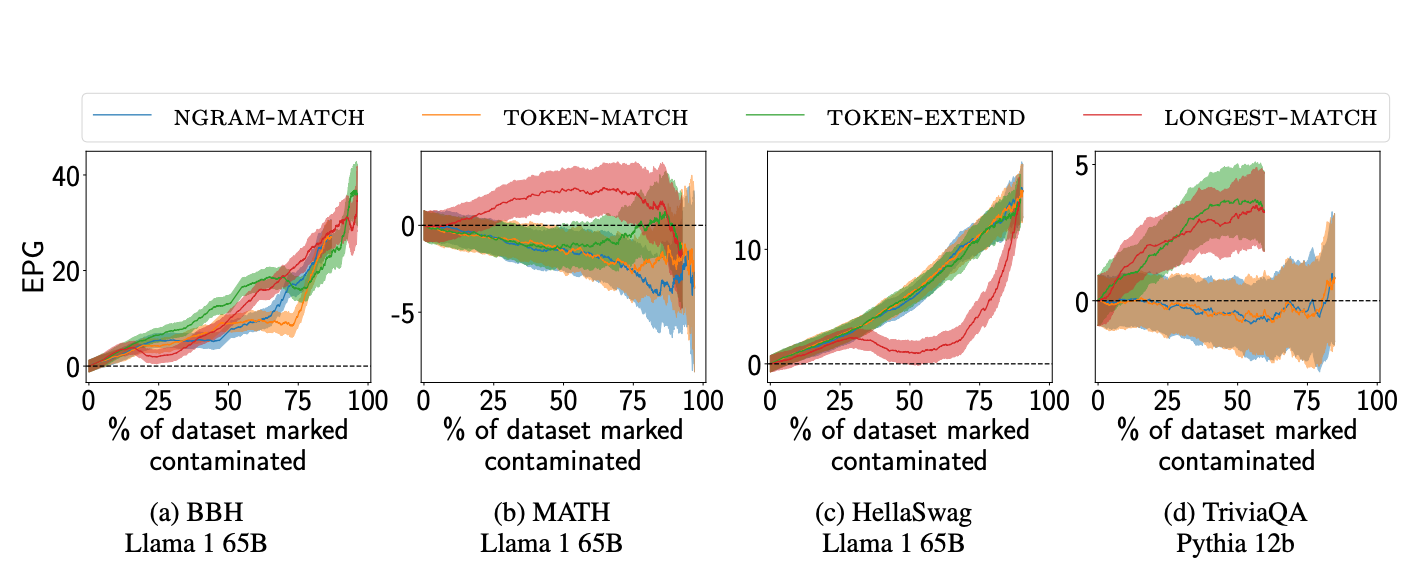
To compare the effectiveness of different contamination metrics, the study uses ConTAM plots, which visualize how the Estimated Performance Gain (EPG) changes as the contamination threshold is adjusted. As the contamination threshold decreases, more and more points will be included in the contaminated set. From this perspective, the effectiveness of the contamination scoring method can thus be interpreted in terms of how many true positives it adds as it removes false positives. By plotting EPG against the percentage of the dataset marked as contaminated, these plots help determine which contamination detection method performs best under different conditions.

From these plots, the authors observed the following:
- LONGEST-MATCH performed the best overall, with higher EPGs on most benchmarks, indicating that it was more successful at detecting contamination where other metrics failed.
- All methods are comparable, with no significant difference in EPGs per contamination detection reported.
- A few profiles are shared only across a few model-benchmark pairs, indicating that both these benchmarks are evaluated in cloze format, directly comparing the log-likelihood of the possible answers. This might result in unrelated occurrences of substrings in the correct answer, contributing to increasing the likelihood of the correct answer.
- LONGEST-MATCH and TOKEN-EXTEND perform equally well and better than NGRAMMATCH and TOKEN-MATCH on Pythia models on the TriviaQA dataset. It might be that normalization, which is not present in the former two methods, hurts contamination detection.
Conclusion
The study concludes that data contamination has a substantial impact on model performance and must be carefully accounted for when interpreting benchmark results. Larger models are more prone to leveraging contamination, which can inflate their performance scores. To better assess a model’s true capabilities, it’s crucial to use effective contamination detection metrics, like LONGEST-MATCH, and select appropriate thresholds based on the model and benchmark in question.
This research helps remind us that interpretation of benchmark scores should be done with caution, especially as we move toward increasingly powerful models. Data contamination isn’t just an academic issue—it directly affects how we measure and compare the performance of AI systems. We need more research to refine contamination metrics and ensure that evaluations accurately reflect a model’s true abilities.
Maxim is an evaluation platform for testing and evaluating LLM applications. Test your Gen AI application's performance with Maxim.
