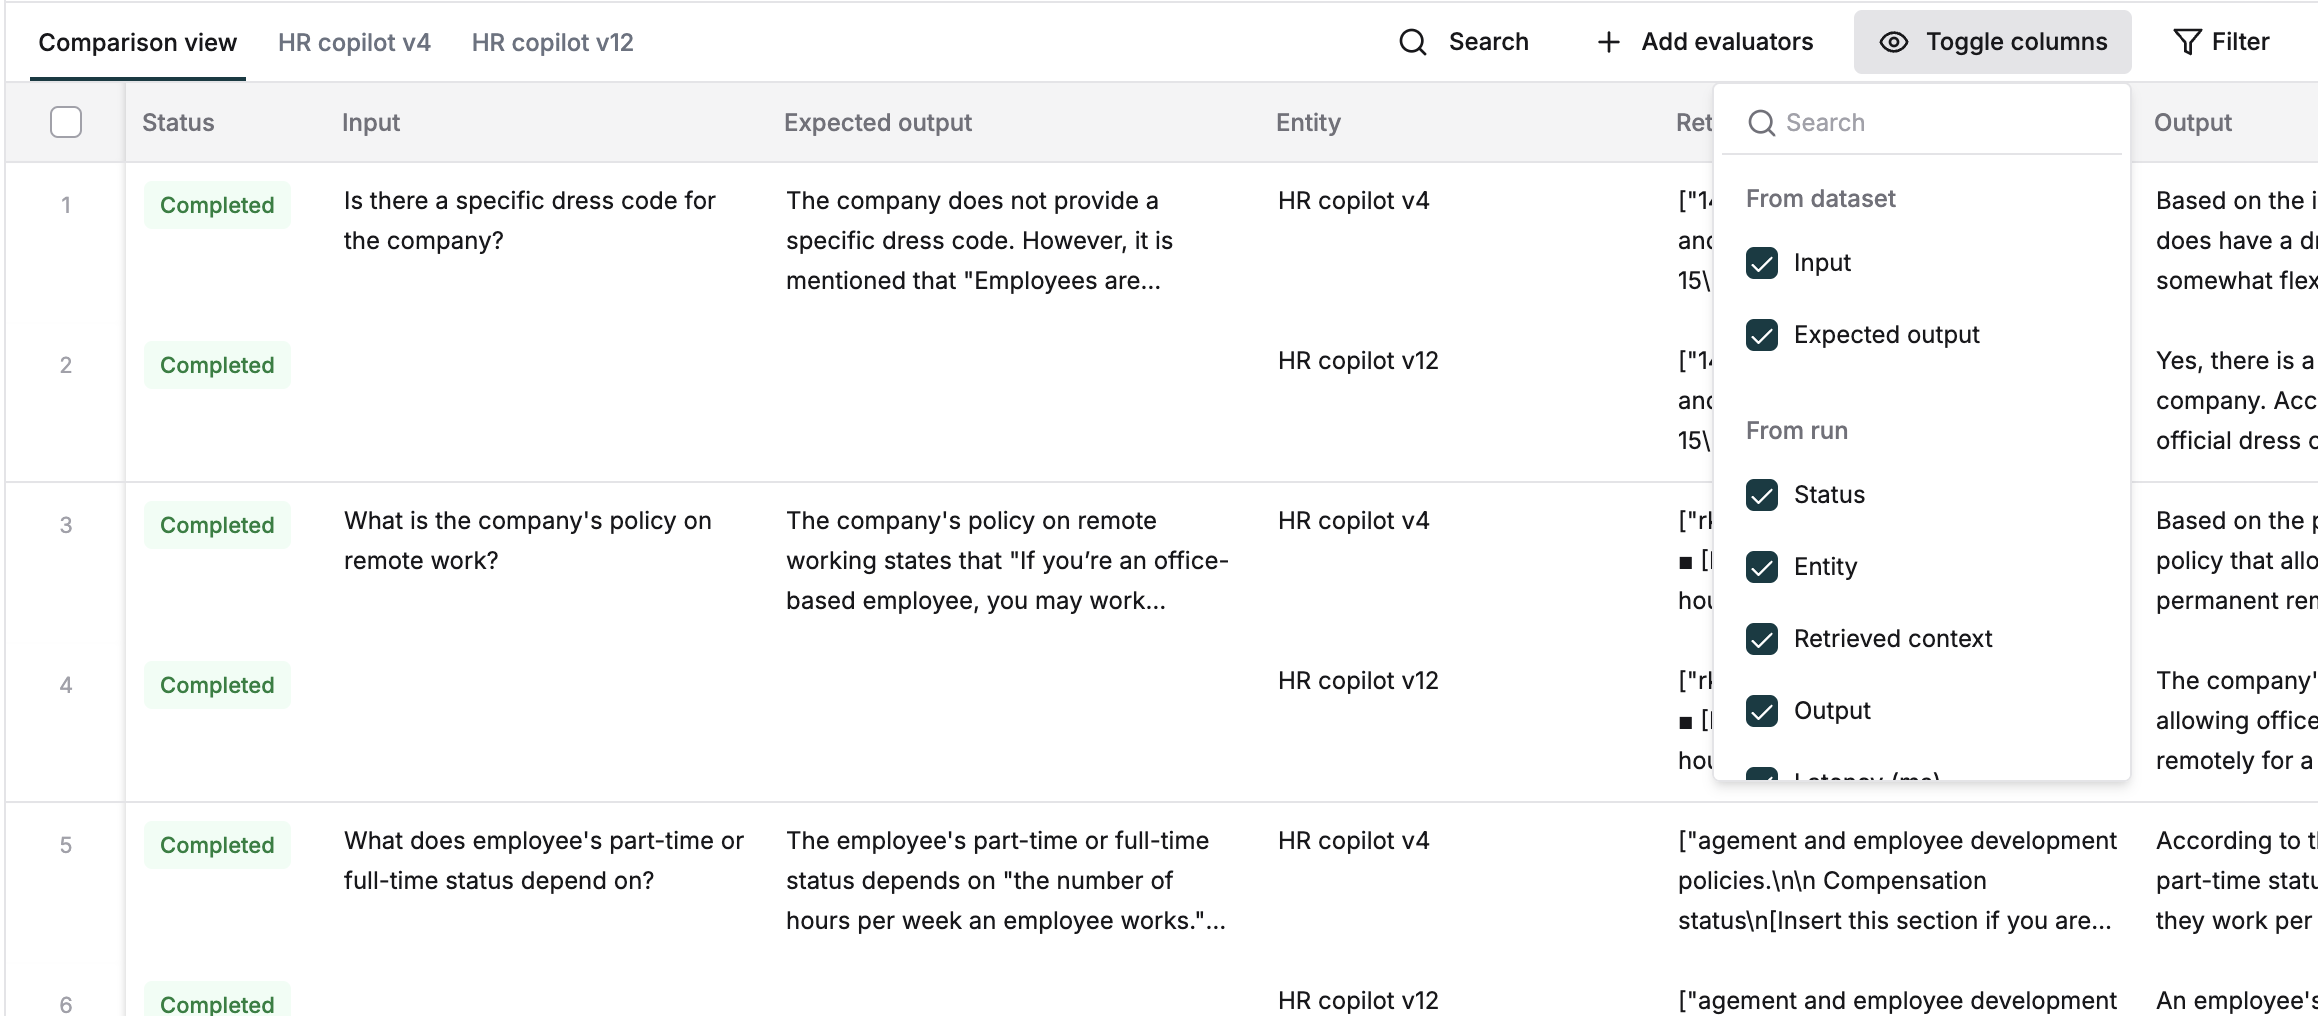
Toggle columns
For prompt/workflow runs, by default we only show the input from the dataset and the retrieved context (if applicable) and output from the run. However, there might be cases where you want to see other dataset columns to analyze the output. Similarly, you may want to hide some already visible columns in order to see limited data while analyzing evaluations. To show/hide columns, follow the below steps:Clicking on this will open a dropdown with options of all columns from the dataset and the run result
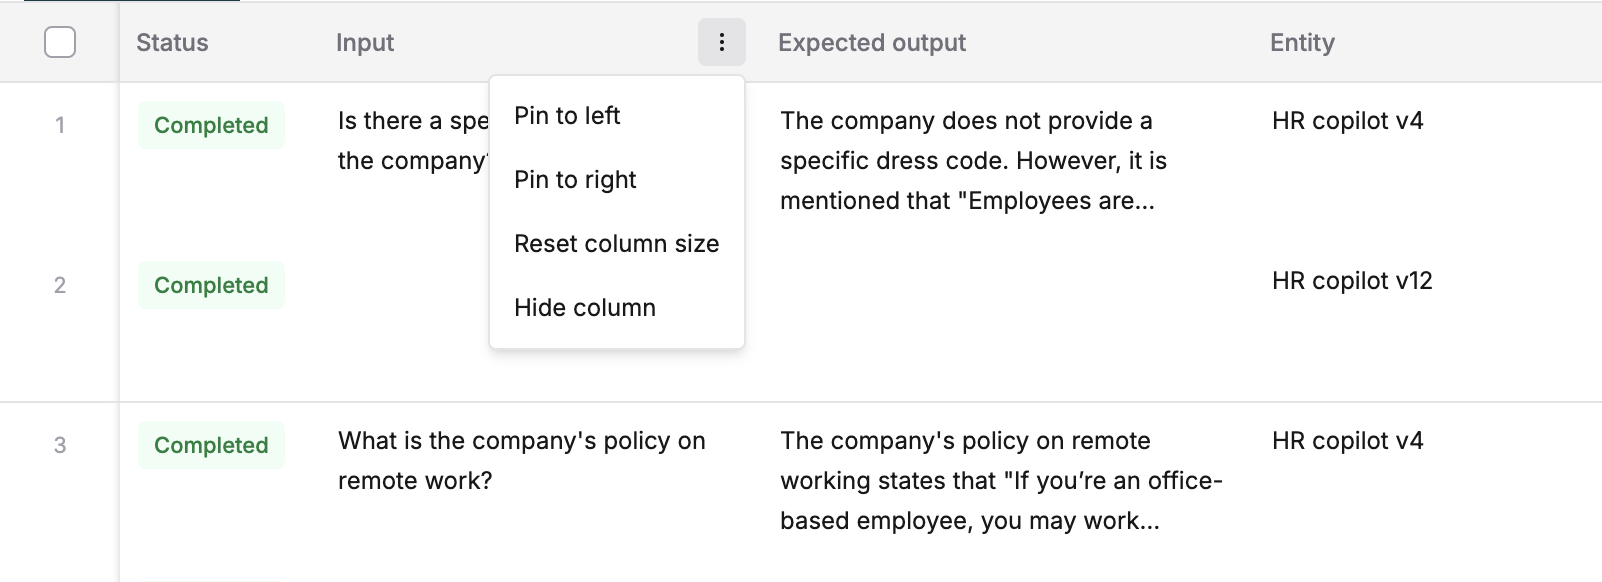
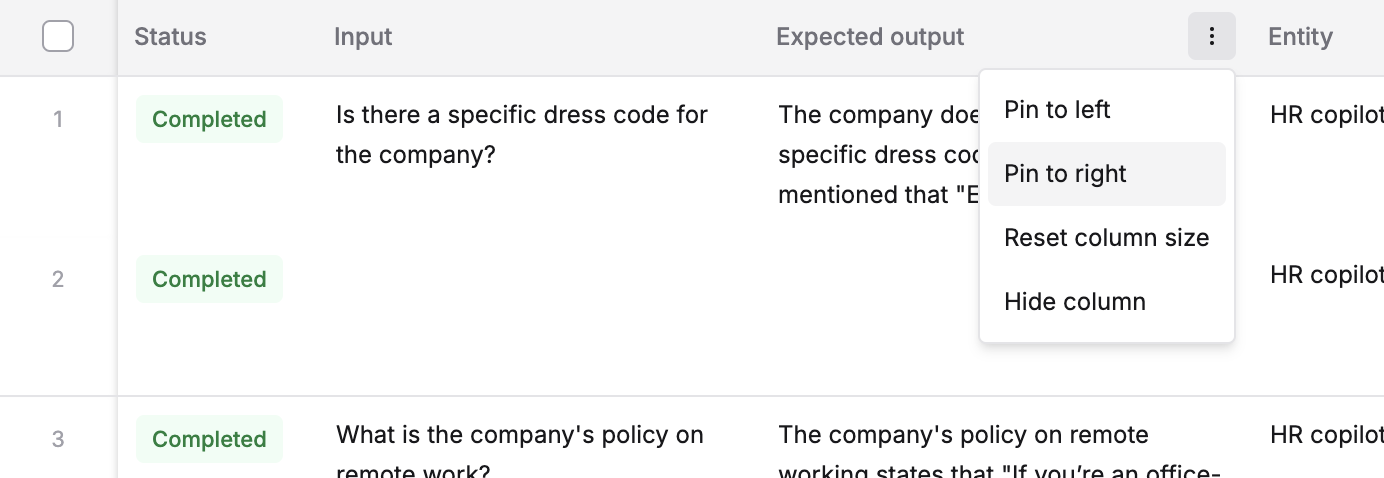
Pinning columns
While analyzing the report, you can horizontally scroll to see all columns. In case you have certain columns that you would want to always have as reference while looking at rest of the data, you can pin them. Eg. Pin inputs columns to the left and a certain evaluation column to the right while analyzing the retrieved context, output, etc. To pin a column, click the 3 dots buttons on the row header and choosePin to left or Pin to right. You can also unpin the column in the same way.
Re-ordering columns
You can easily re-order all columns of the table by holding down the button shown in the below screenshot and dragging the column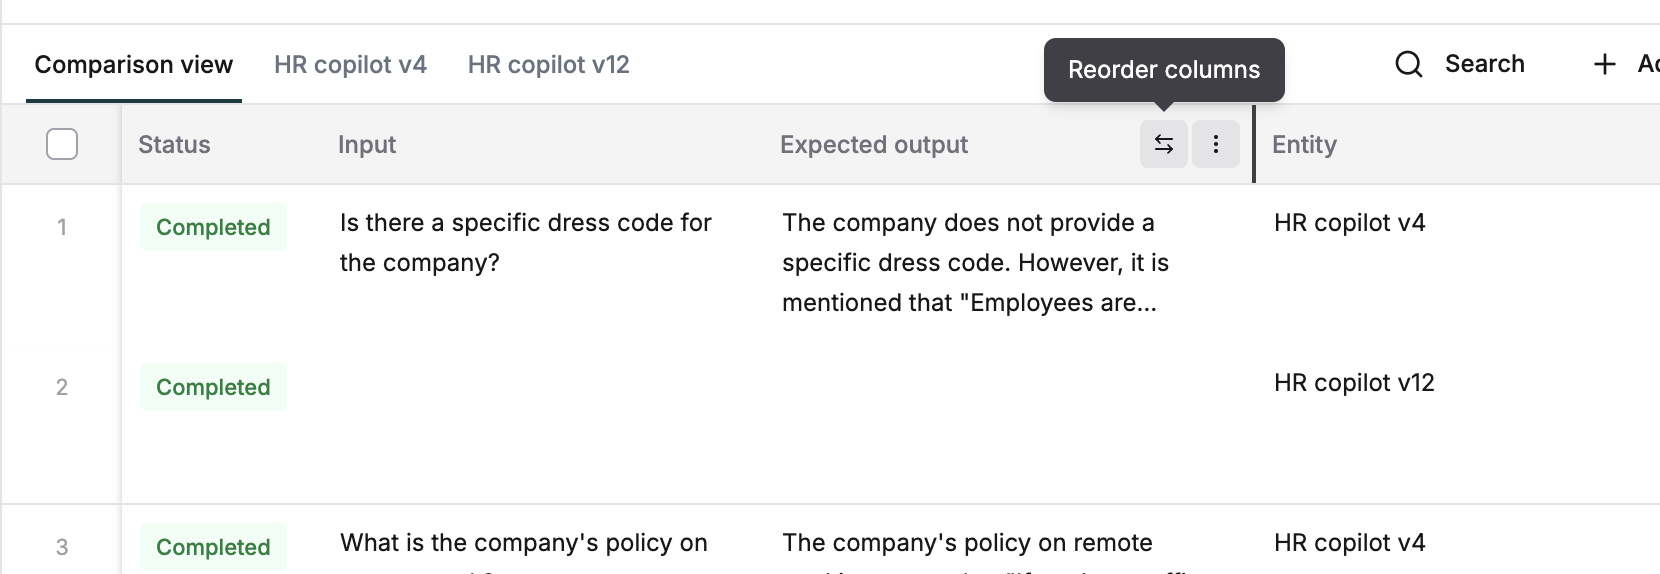
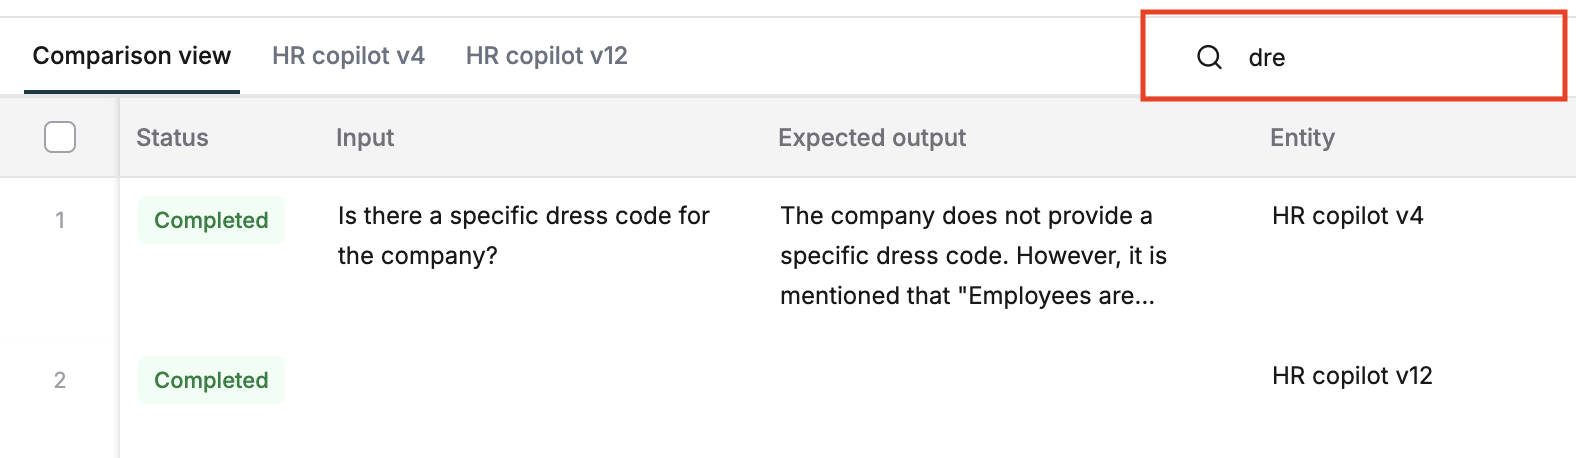
Search and filter
In case of large reports with a lot of entries, you can use the search or filters to easily reach the relevant entries you care about. Filtering allows you to put a combination of criteria. These could be performance metrics or evaluation scores. You can also directly filter out the results that are failing on a particular metric by clicking the filter icon next to its score in the summary card.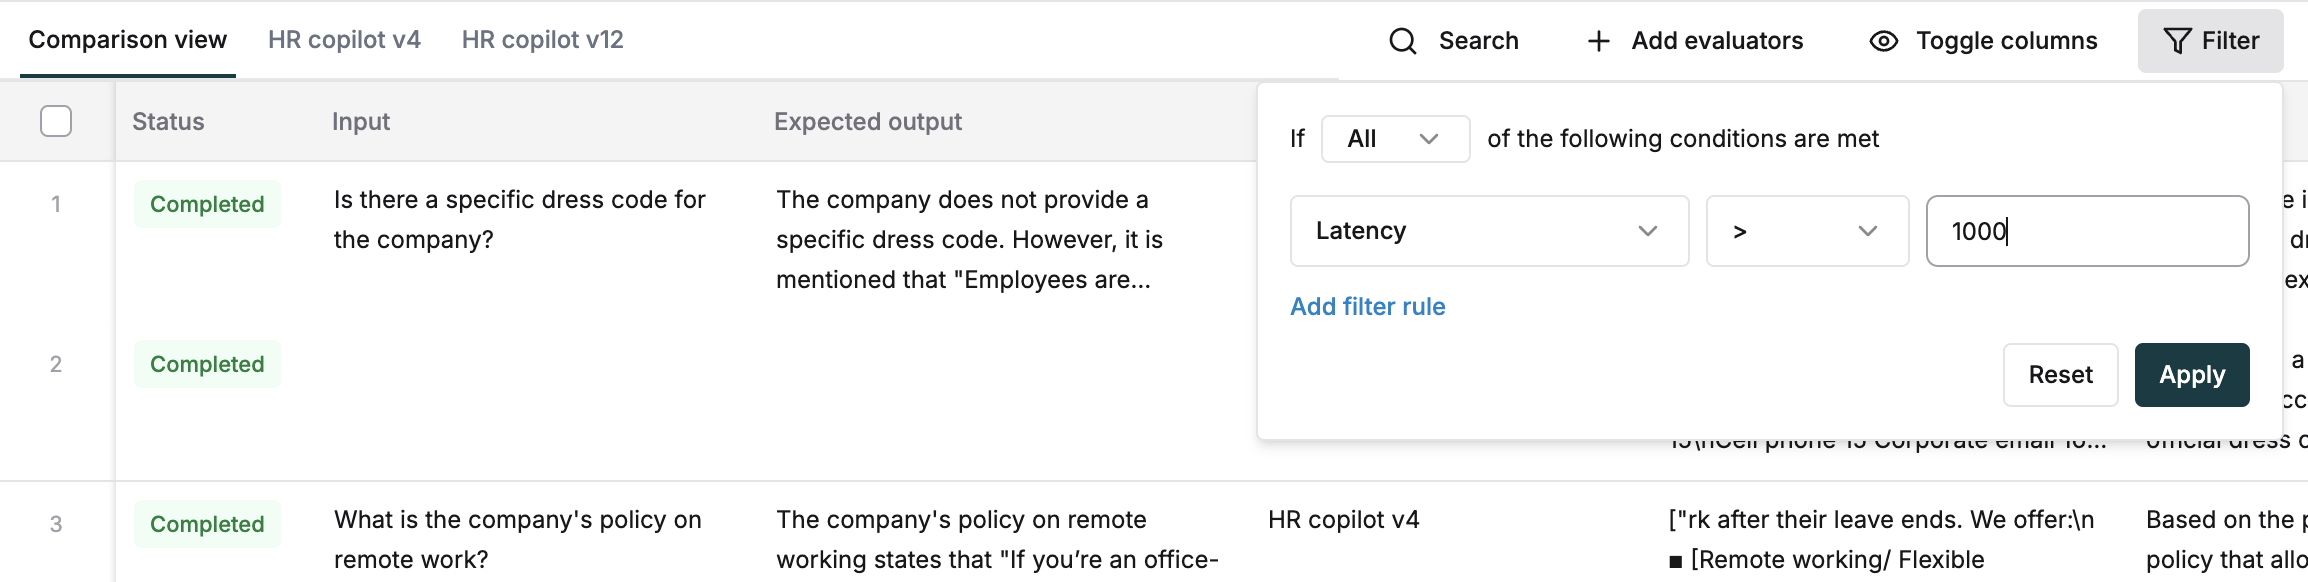
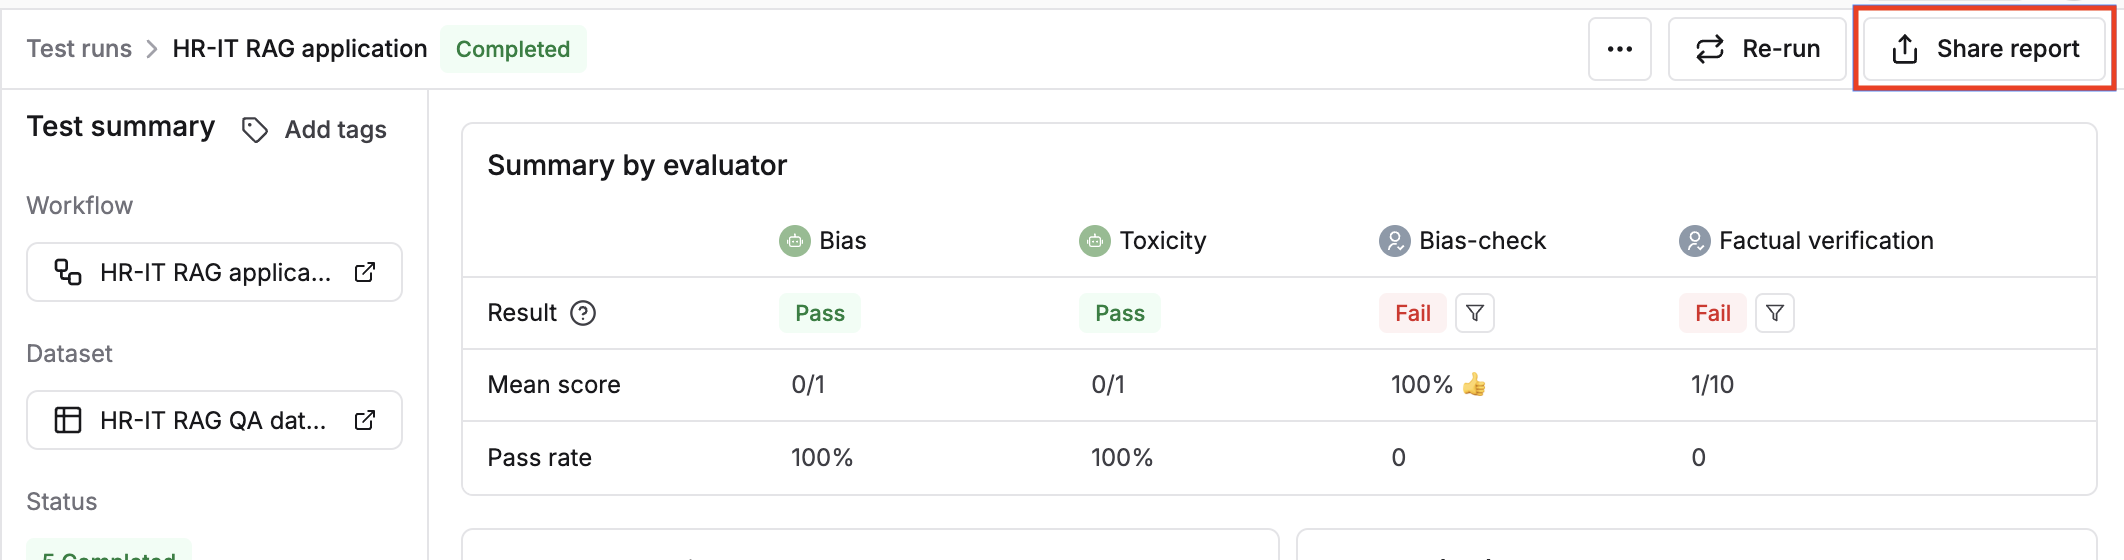
Share links
Share results of runs with external stakeholders via a read-only link that can be accessed without being on the Maxim dashboard. Click theshare report button on the header of any run report, and a link to the current view will be copied to your clipboard.