How to set up distributed tracing?
This guide demonstrates distributed tracing setup using an enterprise search chatbot (similar to Glean) example that:- Connects to company data sources (Google Drive, Dropbox)
- Enables natural language search across data via Slack or web interface
System architecture
The application uses 5 microservices: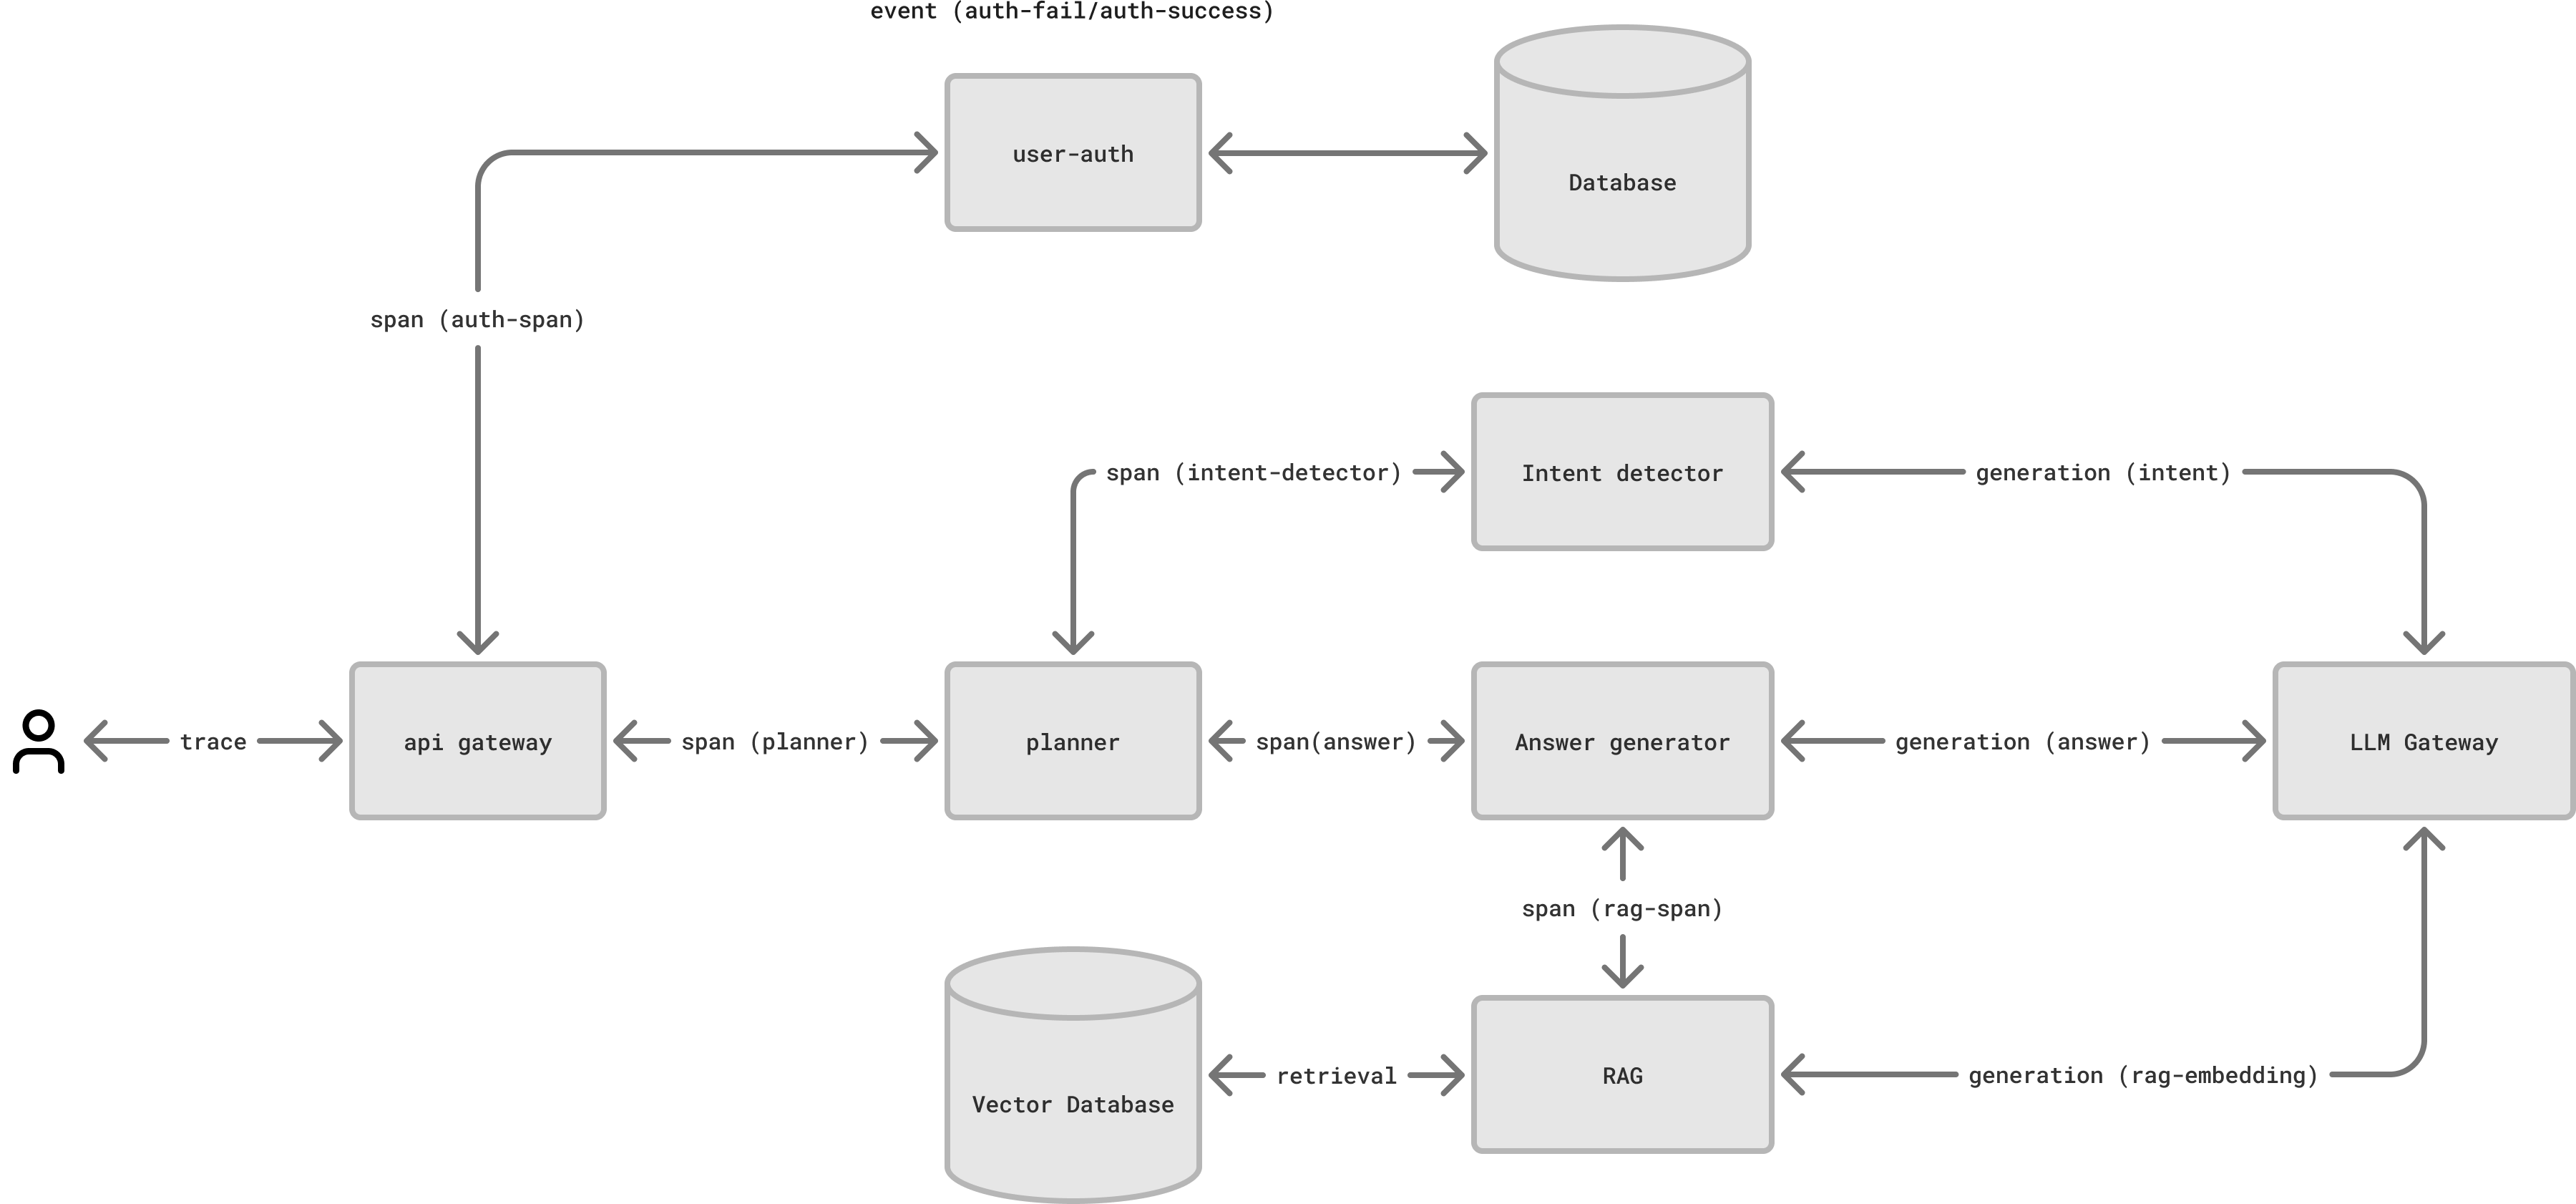
- API Gateway: Authenticates the users and routes API requests
- Planner: Creates execution plans for queries
- Intent detector: Analyzes query intent
- Answer generator: Creates prompts based on planner instructions and RAG context
- RAG pipeline: Retrieves relevant information from vector database
Setting up the Maxim dashboard
1. Create Maxim repository
Create a new repository called “Chatbot production”:2. Generate API key
3. Install SDK
Python
Go
Java
4. Initialize logger
Add this code to initialize the logger in each service:5. Create trace in API gateway
Usecf-request-id as trace identifier:
You can manipulate every entity of Maxim observability framework (Span, Generation, Retrieval, Event) in the same way.
6. Add spans in services
Create spans to track operations in each service:When creating spans, consider adding relevant tags that provide context about the operation being performed. These tags help in filtering and analyzing traces later. Remember to end each span once its operation completes to ensure accurate timing measurements.
7. Log LLM calls
Maxim currently supports OpenAI message format. to convert other messaging formats to OpenAI format in the SDK.
View traces
Access your traces in the Maxim dashboard within seconds of logging. The dashboard shows:- Complete request lifecycle
- Durations and relationships of the Entities (Span/Trace)
- LLM generation details
- Performance metrics
Schedule a demo to see how Maxim AI helps teams ship reliable agents.