Observe and improve your AI agents’ quality
Ensure your agents perform reliably in production with powerful, real-time insights.


.png)


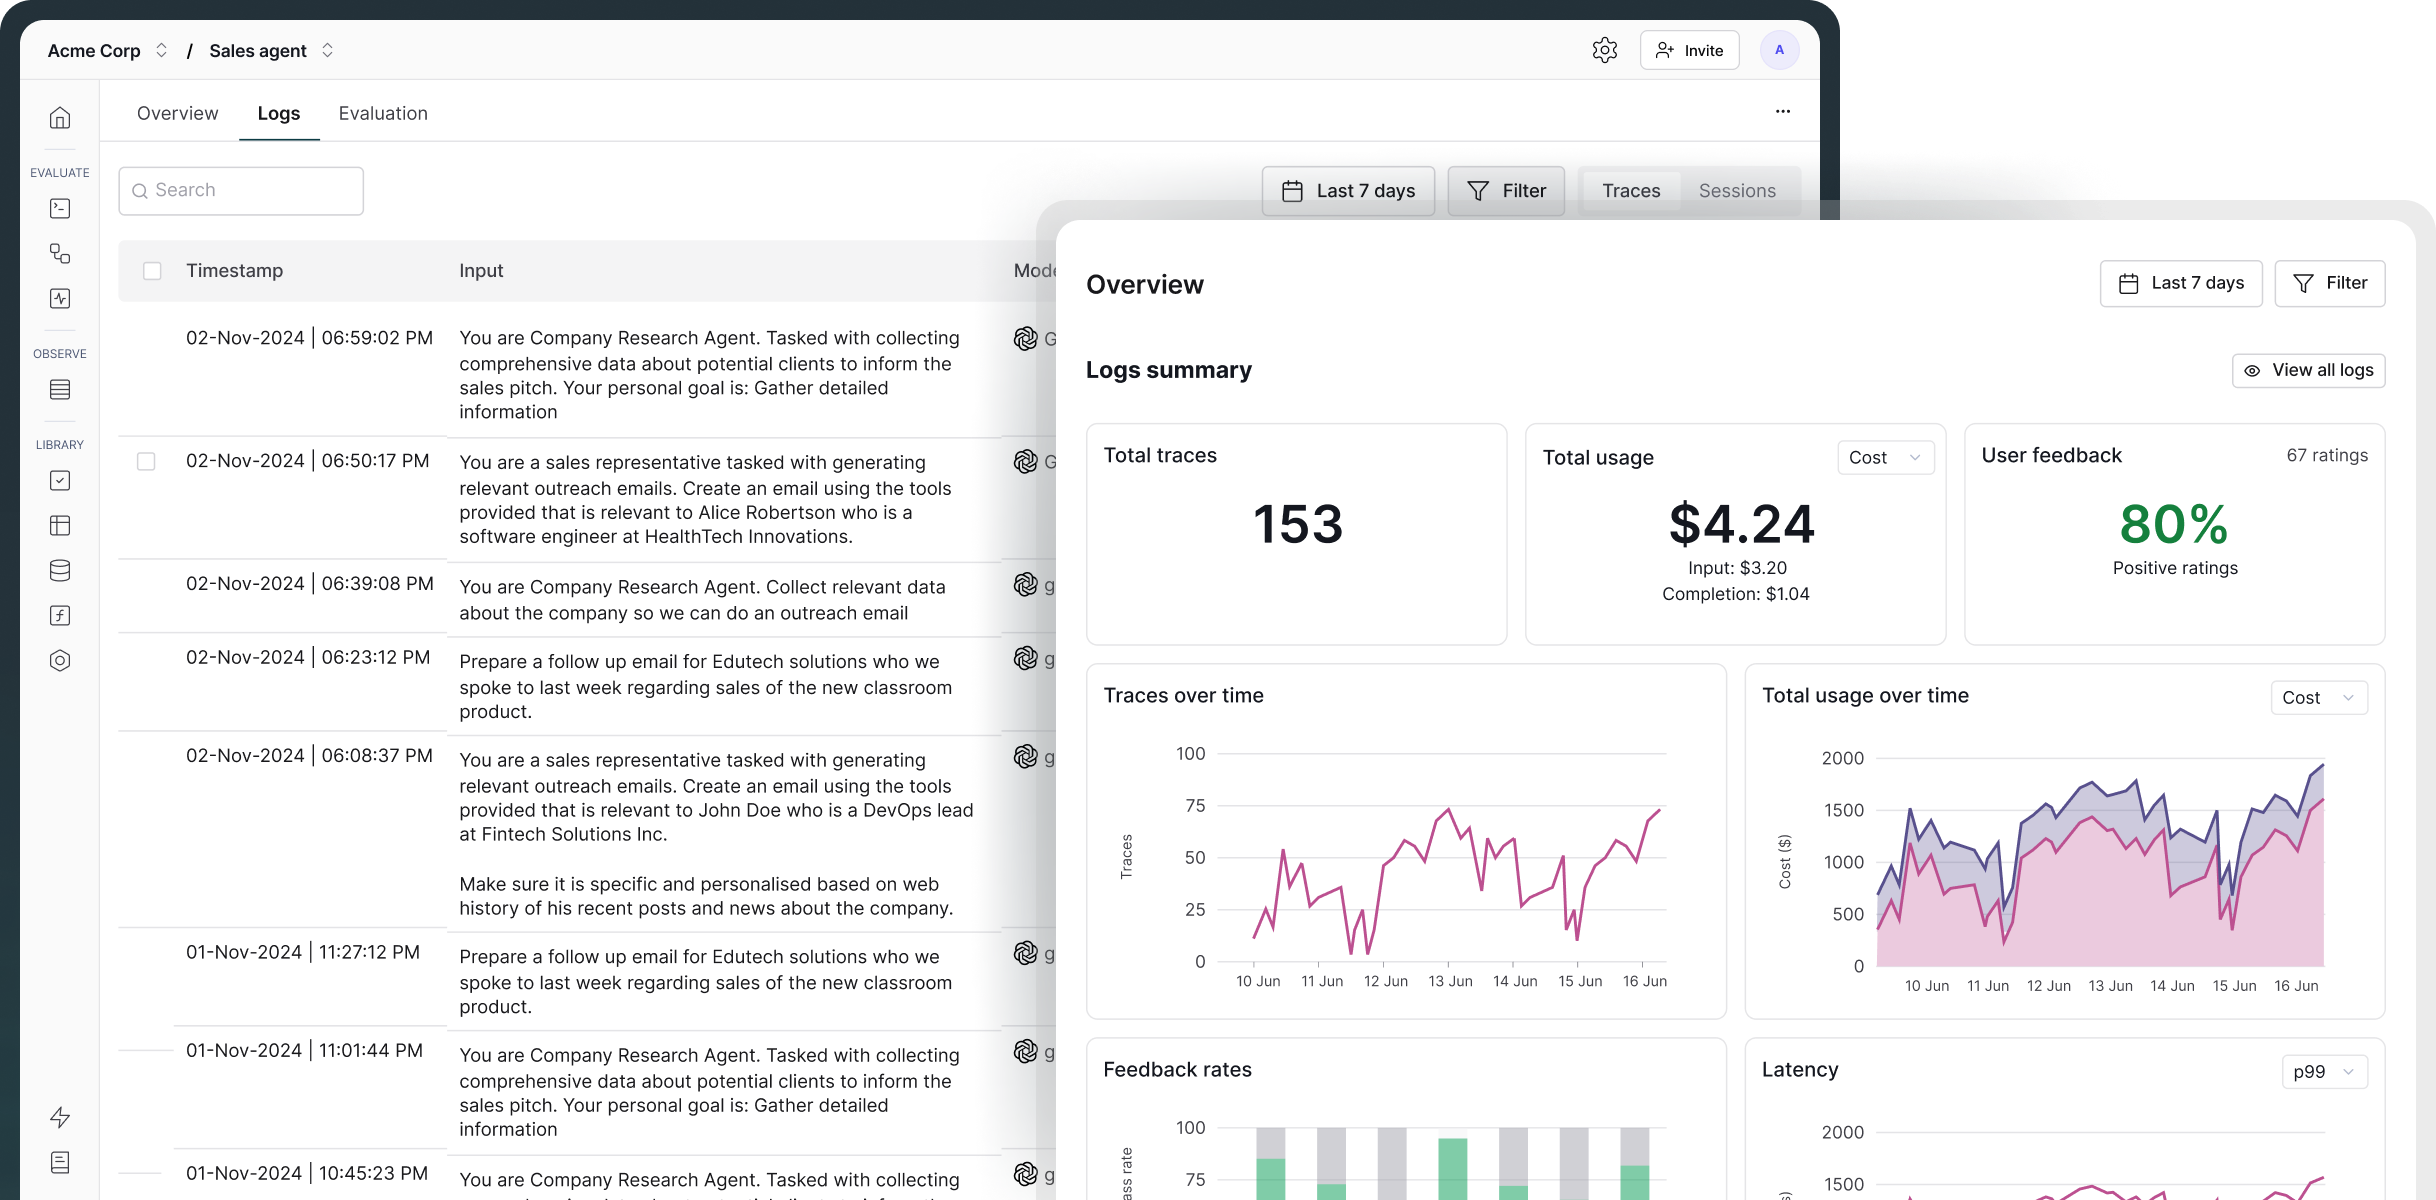
AI observability refers to the ability to monitor, trace, and evaluate AI system behavior across real-world interactions. For agents, it means gaining visibility into decision-making, model outputs, and performance at every step. This helps teams identify failures, debug issues, improve reliability, and ensure alignment with business and user goals.
(See: Observability overview, Quickstart guide)
Maxim provides deep, distributed tracing that spans across traditional infrastructure and LLM-specific elements like prompts, responses, tool use, and context injection. You can view trace timelines visually, step through interactions, and debug issues from individual spans down to token-level behavior.
Yes. Maxim offers online evaluators that continuously assess real-world agent interactions. You can evaluate sessions or spans using automated metrics like faithfulness, toxicity, helpfulness, or define your own criteria. These scores help identify drift or emerging quality issues without waiting for batch test runs.
Absolutely. Maxim allows you to configure custom alerts based on key metrics like latency, token usage, evaluation scores, or other metadata. You can route these alerts to Slack, PagerDuty, or any webhook to notify the right teams instantly when things go wrong.
Yes. Maxim supports native integrations with leading agent orchestration frameworks and LLM stacks. You can add monitoring and observability to your workflows without needing to refactor application logic.
(See: OpenAI Agents SDK integration)
Yes. Maxim is OTel-compatible, allowing you to forward traces, logs, and evaluation data to third-party observability platforms like New Relic, Grafana, or Datadog. This helps unify traditional and AI observability under a single pane of glass.
(See: Maxim OTel Blog)
Maxim provides seamless data export capabilities via CSV downloads or APIs. You can export trace data, evaluation scores, and annotations for custom dashboards, audits, or offline analysis.
