Documentation Index
Fetch the complete documentation index at: https://www.getmaxim.ai/docs/llms.txt
Use this file to discover all available pages before exploring further.
Improve your AI application outcomes
Build and monitor reliable AI applications for consistent results:- Monitor AI model performance in production
- Detect and resolve issues proactively
- Improve response quality through data-driven insights
- Reduce costs with optimized resource usage
Understanding LLM observability challenges
Why does traditional monitoring fail with LLM applications?- Cannot track prompt and completion correlations - Traditional tools lack the ability to correlate input prompts with their corresponding outputs
- Cannot monitor critical LLM metrics - Missing essential metrics like token usage, model parameters, and response quality
- Struggles with mixed data types - Ineffective at processing both structured and unstructured data simultaneously
- Cannot trace reasoning processes - Unable to debug black-box LLM failures or understand internal reasoning
- Fail to track complex workflows - Cannot handle RAG systems, tool calling, and multi-step reasoning chains
- Limited human feedback support - Provide minimal capabilities for collecting and analyzing human feedback and preference models
- Lack subjective metric tracking - Missing support for user ratings, A/B testing, and quality assessments
Maxim’s solution
1. Comprehensive distributed tracing
Track the complete request lifecycle, including LLM requests and responses. Debug precisely with end-to-end application flow visibility.2. Zero-state SDK architecture
Maintain robust observability across functions, classes, and microservices without state management complexity.3. Open source compatibility
Maxim logging is inspired by (and highly compatible with) open telemetry:- Generate idempotent commit logs for every function call
- Support high concurrency and network instability
- Maintain accurate trace timelines regardless of log arrival order
- Production-proven reliability with over one billion indexed logs
Key Features
Real-time monitoring and alerting
Track GenAI metrics through distributed tracing and receive instant alerts via:- Slack
- PagerDuty
- OpsGenie
- Cost per trace
- Token usage
- User feedback patterns
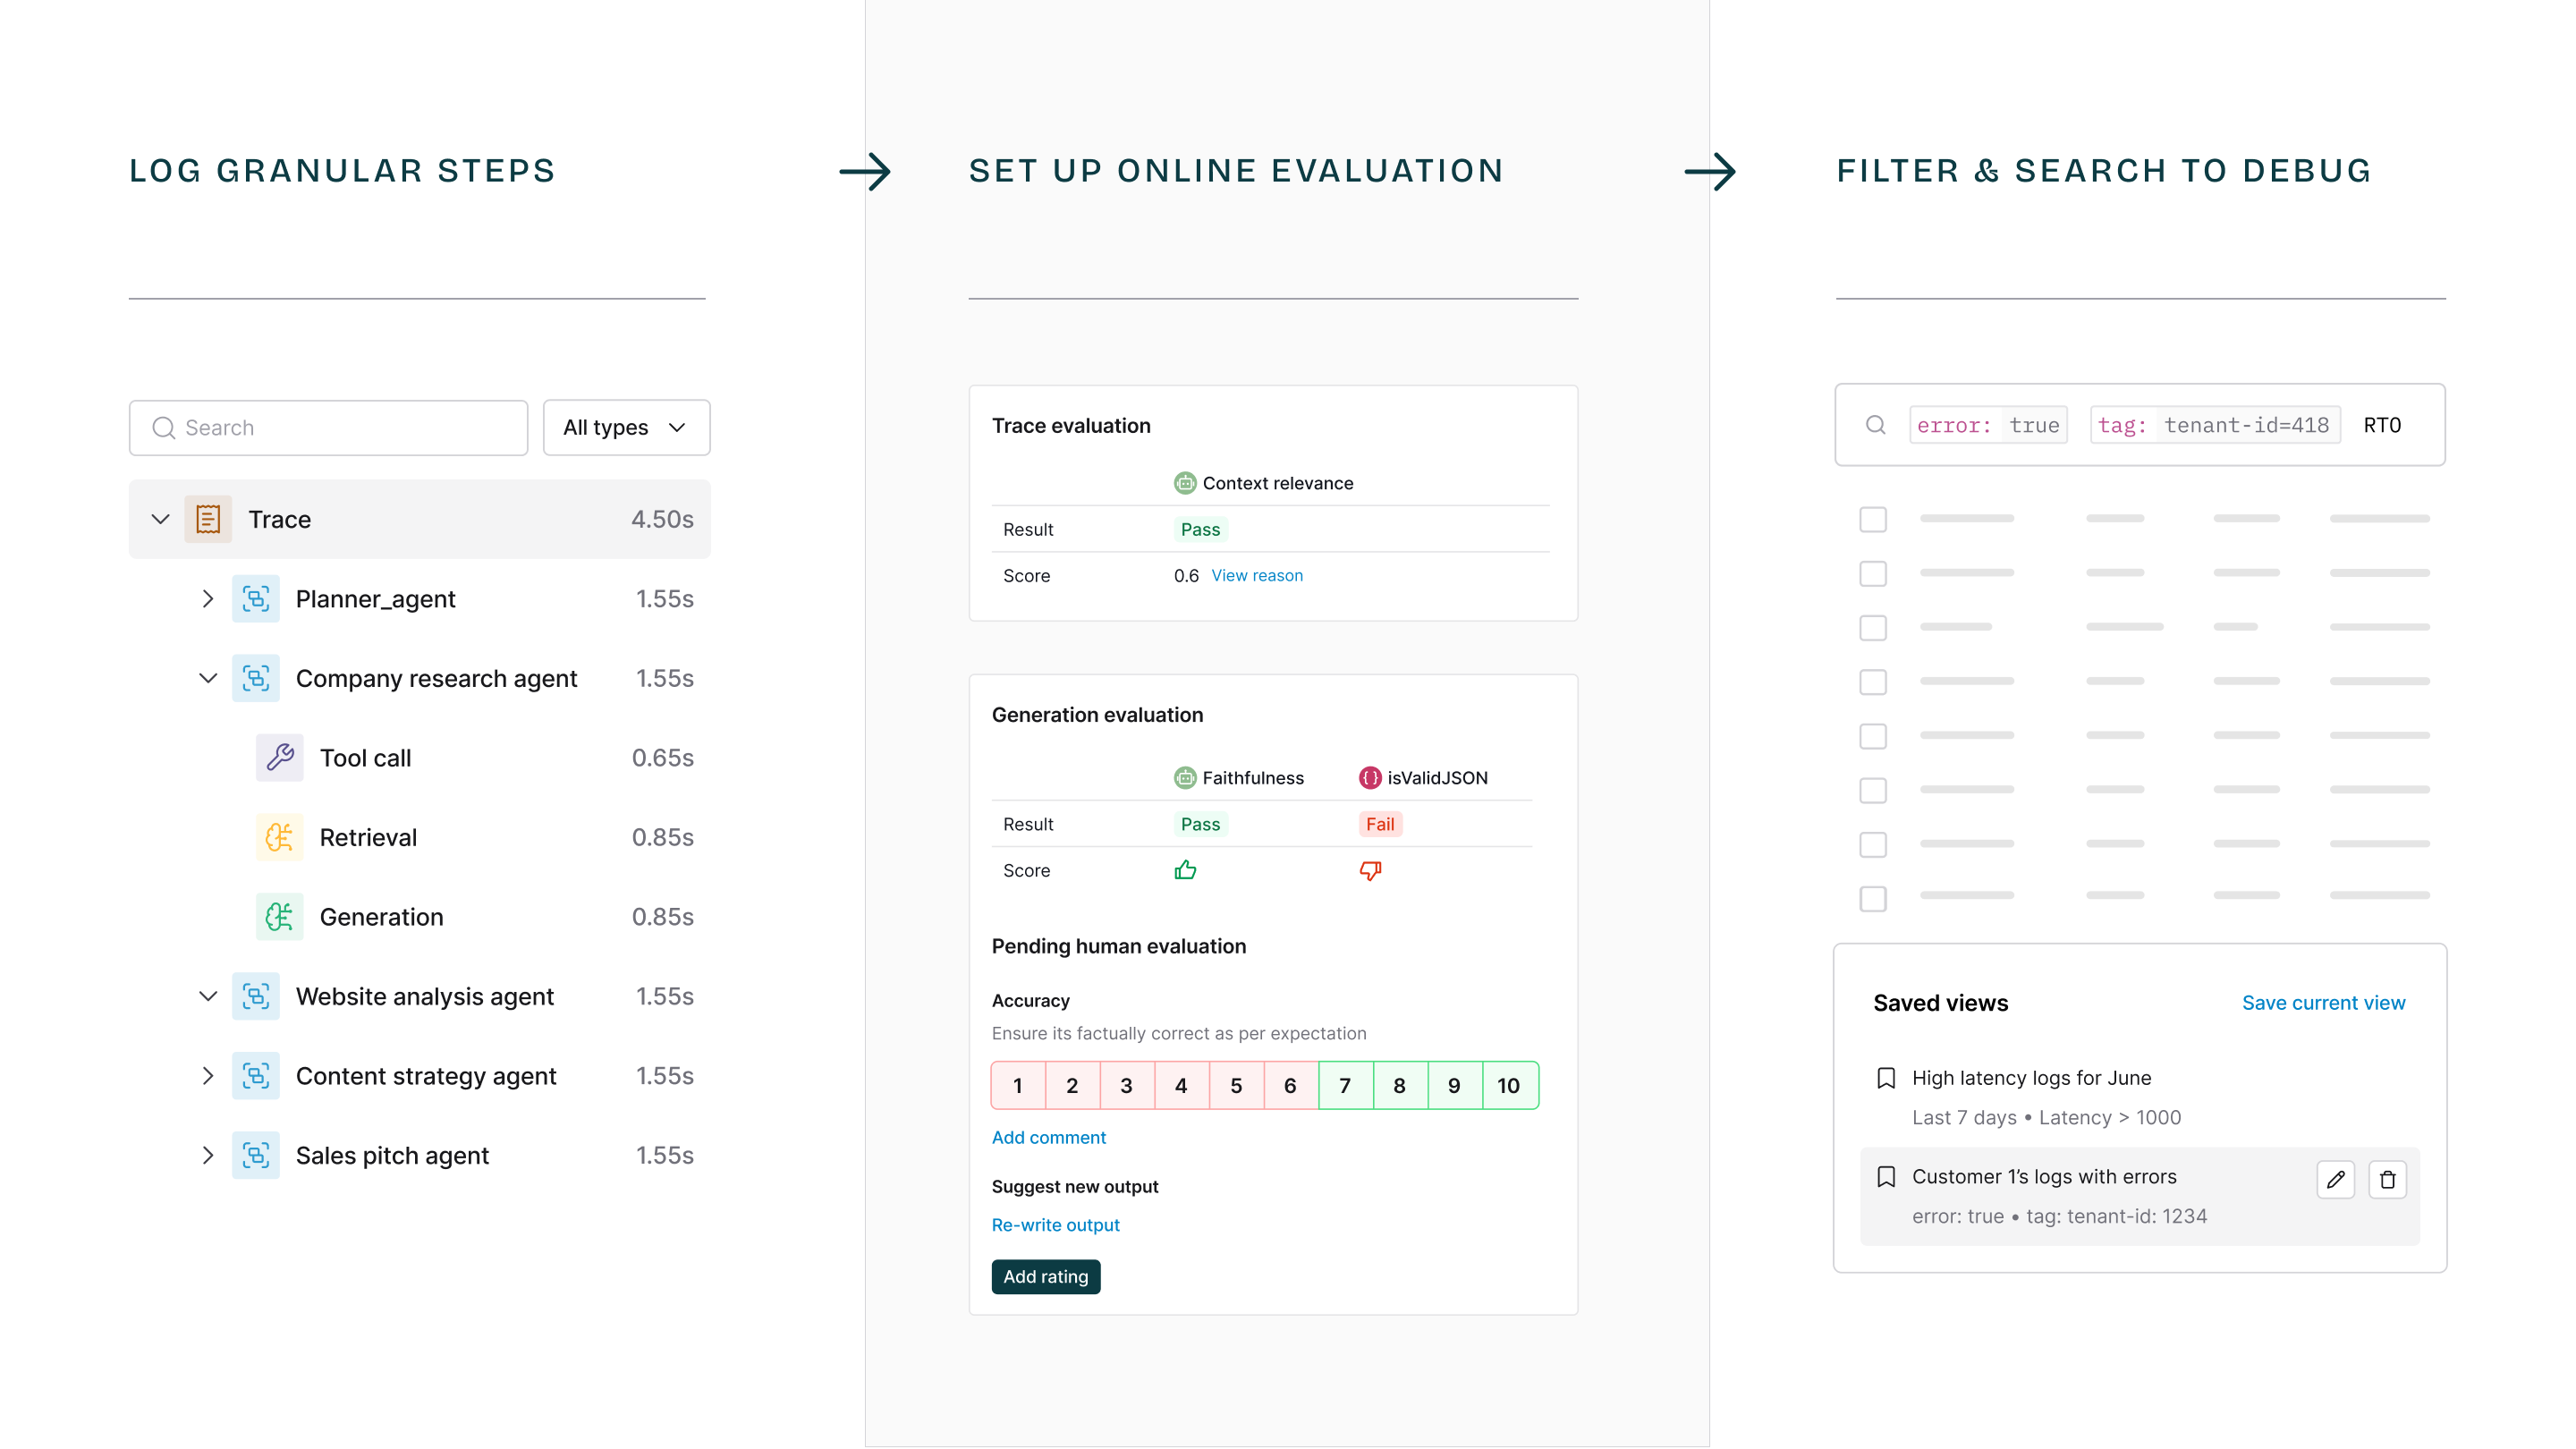
Saved views
Find common search patterns instantly:- Store common search patterns
- Create debugging shortcuts
- Speed up issue resolution
Online evaluation
Monitor application performance with:- Custom filters and rules
- Automated reports
- Threshold-based alerts
Data curation
Transform logs into valuable datasets:- Create datasets with one click
- Filter incoming logs
- Build targeted training data
- Update datasets for prompt improvements
Schedule a demo to see how Maxim AI helps teams ship reliable agents.